
This blog post is a follow-up to the post Using Automation to Facilitate Flipped Learning.
Due to the success of using Microsoft Power Automate to support flipped learning for an advanced KEATS training session, the Power Automate process was rolled out to all training sessions offered by Centre for Technology Enhanced Learning (CTEL) and other elements of the Microsoft Power Platform have been introduced. This blog post will outline the processes, successes, and challenges.
Rollout of Power Automate Process
Once the decision was made by the CTEL CPD Chair to roll out the Power Automate process to all CTEL training sessions, we needed to decide how this would work practically. The established process, or flow, used for the KEATS: Personalising the Learning Experience training session was built specifically for that session and was the only one that included pre-session work. We navigated around this by creating individual flows for each of the sessions run by CTEL and removing and adding steps as appropriate. The Assistant Learning Technologist for the team and I worked closely with the session leads, customising and creating the flows and encouraging personalisation of their flows to better reflect their sessions, such as adding attachments and editing email text.
Another risk was that the flows would reference the same Microsoft Excel spreadsheet hosted on a SharePoint site, and with multiple people accessing and changing the data, flows could be affected and send out emails at the wrong time. We navigated around this by creating individual spreadsheets and pointing the flows to the relevant spreadsheets for each session, which allowed for further customisation from session leads if desired.
Flows are usually triggered 2 working days before the session is scheduled, but this can vary if the pre-session work required will take more time to complete. The core template automatically completes 5 core steps when triggered:
- Creates a Microsoft Teams Meeting and invites all attendees to the meeting.
- Sends an email containing further information about the session if needed. This is on a 5-minute delay to allow for any manual intervention should any mistakes be made in step 1.
- Sends an email to participants as soon as the scheduled session is finished containing links to further resources and a request for feedback to be left via the Microsoft Form.
- Sends an email 2 working days to participants after the session has been completed, asking for feedback if it hasn’t been left.
- Sends an email 10 working days after the session to participants to ask if they have attempted any content that was covered in the session and if they have any success stories to share or need any further support.
The above template is core and session leads can add further steps as relevant to their own flows. Working days are calculated within formulas in the Excel spreadsheet and are utilised to increase the response rate, rather than send emails out over a weekend or bank holiday which can be ignored.
Displaying Feedback in Power BI
The Power Automate process outlined above is fairly simple in terms of its structure and aims; it sends out emails at predetermined times based on the date and time of the relevant session, which is calculated in the Microsoft Excel spreadsheet. Each email sent to attendees once the session has been completed contains a link to CTELs feedback form. Once feedback is submitted, it is collected, anonymised, and stored. I designed a Power BI report to display the quantitative and qualitative data submitted to display the impact of the sessions and assist each session lead with making any changes using free text submissions.

After organising this data and gaining experience in Power BI, I was able to link this data to attendance data extracted from SkillsForge, to gain insights into our historical CPD attendance and how this relates to our feedback submissions. An advantage to this was to see if the flows had an impact on gathering feedback for our sessions.

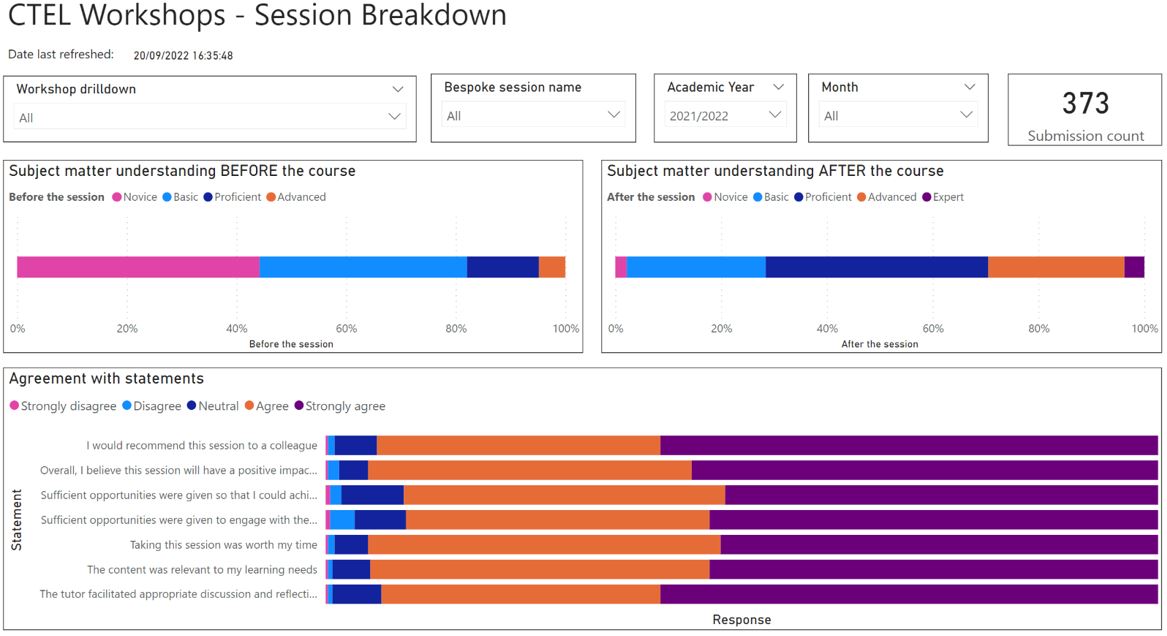
Key findings revealed that attendance for 2020/21 was significantly high with 2209 members of King’s staff signing up for a session offered by CTEL, with feedback submissions at 324, so around 14.7% of attendees left feedback. Attendance dropped for the year 2021/22 with 1247 members of King’s staff signing up for a session. This is to be expected as we saw an increase in face-to-face teaching taking place and there were fewer modules delivering fully online teaching, but feedback submissions increased slightly with 373 submissions, around 30% of attendees submitting feedback. This is a positive revelation as although attendance figures fell by almost three quarters, the total amount of feedback submitted increased, and the percentage rate doubled. However, we need to be aware of several caveats with this data.

- As previously mentioned, the teaching in the academic year 2020/21 was delivered fully online. 2021/22 saw a gradual increase in face-to-face teaching from January onwards, so this data isn’t 100% comparable due to a significant change in circumstances.
- CTEL ran a total of 29 ‘Breakout Rooms in Microsoft Teams Meetings’ training sessions in 2020/21 with 861 sign-ups, which massively increases attendance data for that academic year. 719 sign-ups occurred in September alone. Breakout rooms were a highly desirable feature of Microsoft Teams Meetings, but the functionality was not robust enough to be rolled out en masse, which may have impacted feedback submissions.
- As digital capabilities in King’s staff increased throughout the months of the pandemic and demands on staff members’ time have reduced, this may have resulted in more time to engage with and submit feedback.
During the academic year 2020/21, CTEL joined other departments across King’s to offer a full suite of training opportunities in delivering teaching online. During that time, a generic feedback form was sent to attendees which were mainly concerned with joining instructions to Teams Meeting links, so we cannot see detailed responses to questions usually asked on the CTEL feedback form. Based on the 373 feedback responses submitted in 2021/22:
- ~94% agreed or strongly agreed that they would recommend a CTEL training session to a colleague
- ~95% agreed or strongly agreed that the session they attended will have a positive impact on their teaching.
- ~95% agreed or strongly agreed that taking the session was worth their time.
The above is very positive as it demonstrates the impact that CTELs training sessions are having across the King’s community. The feedback form has not been changed for the academic year 2022/23 and so data can be easily compared in the future.
Based on an overview of the data, the Microsoft Power Automate process appears to be working well as the feedback response rate has remained steady as attendance figures have dropped, and Power BI has been a very useful tool to display and filter feedback data. Session leads have fed back that the Power BI report is beneficial and allows greater insight into the feedback for their sessions, and the CTEL CPD Chair has passed on positive feedback regarding the overall attendance data visualisations. I am currently working on an additional Power BI report that will utilise row level security to allow Technology Enhanced Learning Managers across the university to see attendance figures for their own faculties and tailor demand or promote courses that CTEL offer at strategic points in the year.
I am pleased that the automated process works and has helped free up time for CTEL staff and helped increase our feedback response rate, but I am dissatisfied that the session leads need to access two pieces of software (Microsoft Excel and Microsoft Power Automate) to get this to work. I am currently investigating whether I can achieve the same results with a Power App (another Microsoft Power Platform application) to improve usability and increase satisfaction.
Useful Links:
Written by Dave Busson-Crowe

Dave Busson-Crowe is a Learning Technologist at the Centre for Technology Enhanced Learning and has been involved with Learning Technology in some capacity for approximately 6 years.
He has a keen interest in the use of artificial intelligence in education.