Part 2: My experience and reflections
Part 1 of this blog can be found here: https://blogs.kcl.ac.uk/digitaleducation/exploring-the-digital-frontier-revolutionizing-feedback-delivery-with-excel-and-vba-macros-part-1/

I embarked on this journey to a few years ago when I led a large course with more than 700 students and a team of 15 markers. It was a challenging for an early career lecturer to manage the administrative tasks and collaborate with the whole team: standardization, moderation, and uploading/creating feedback documents. The demanding nature of the courses allows for no mistakes or human errors. Working through the clunky and often user-unfriendly interface of Moodle/Turnitin is another difficult obstacle: one would require the Internet to do the marking and as some other colleagues would agree that we often work better off the Internet. Traditional methods were often time-consuming and inconsistent, resulting in delayed feedback that left students wanting more. The technology-driven solution aimed to address these challenges head-on. When I joined KCL in September 2022, I faced the same problems and have been made aware of different initiatives at KBS to improve the feedback and assessment process at KBS. I gathered my own systems over the years and implemented the process during the Jan 2023 marking season. Over the Spring Term 2023, I refined the process with feedback from colleagues who shared the excitements and interest. In June 2023, I presented at the festival to share the practices and implementation strategies for an innovative automation system.
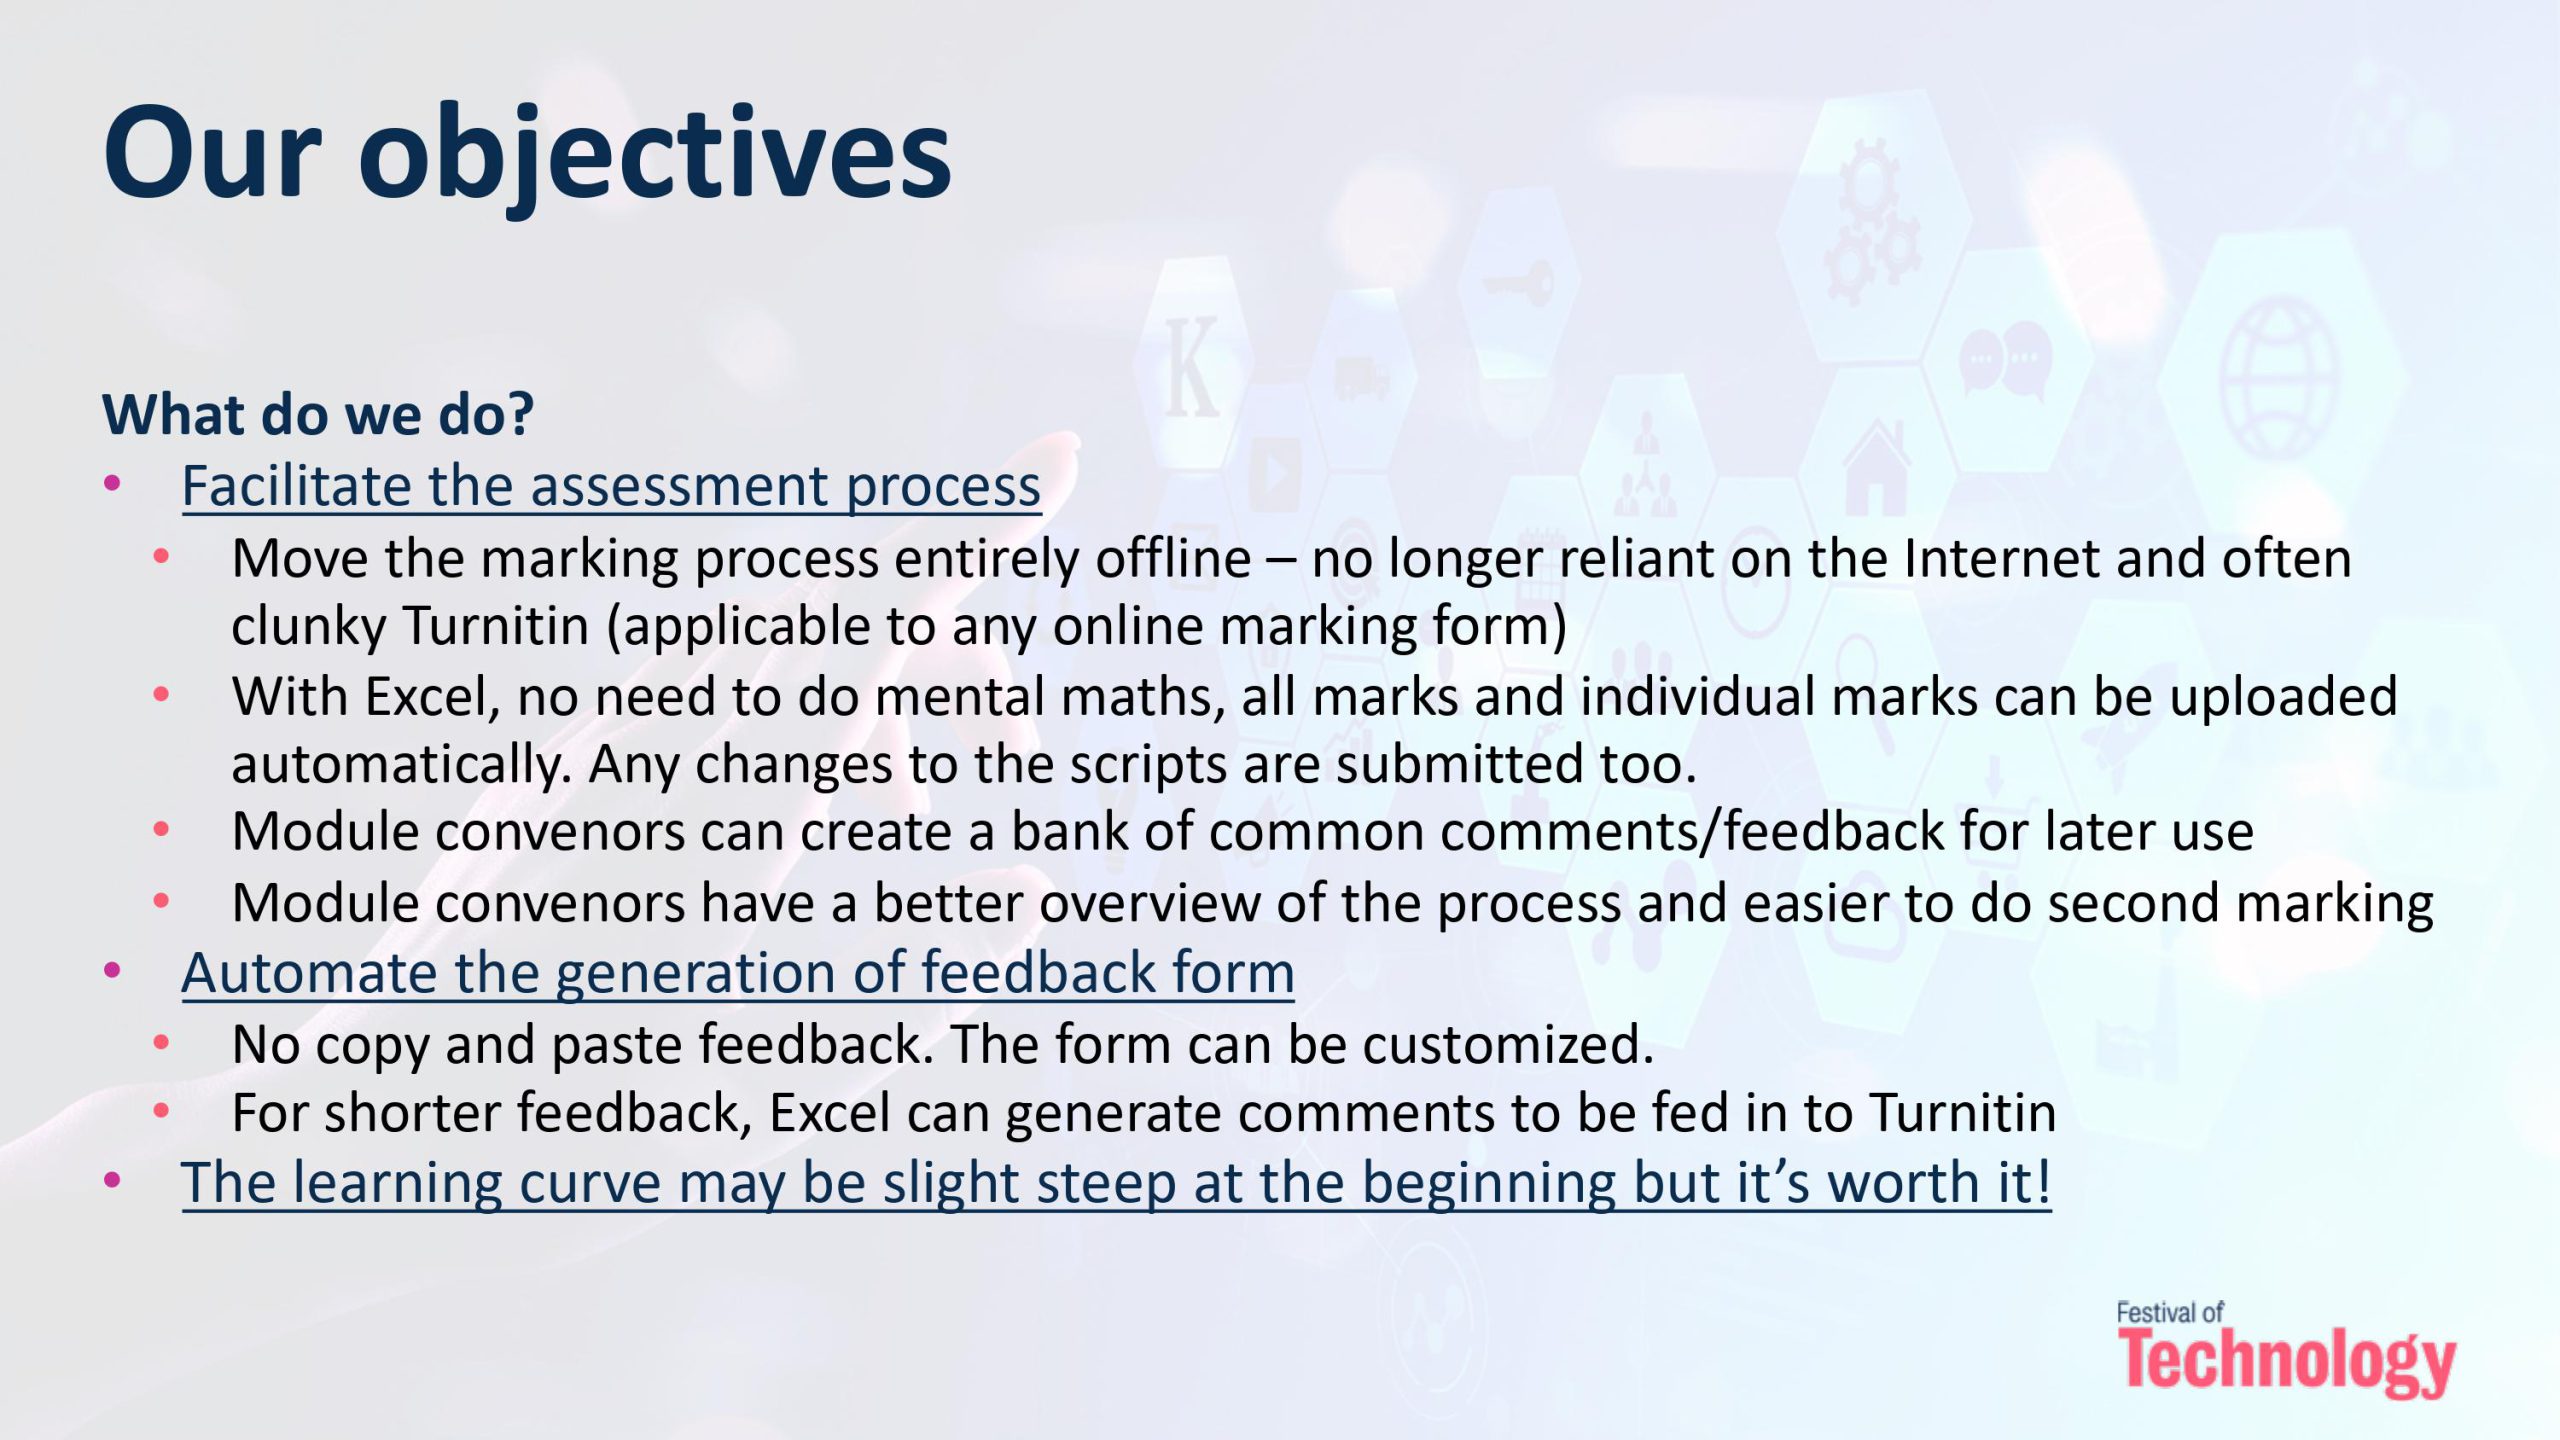
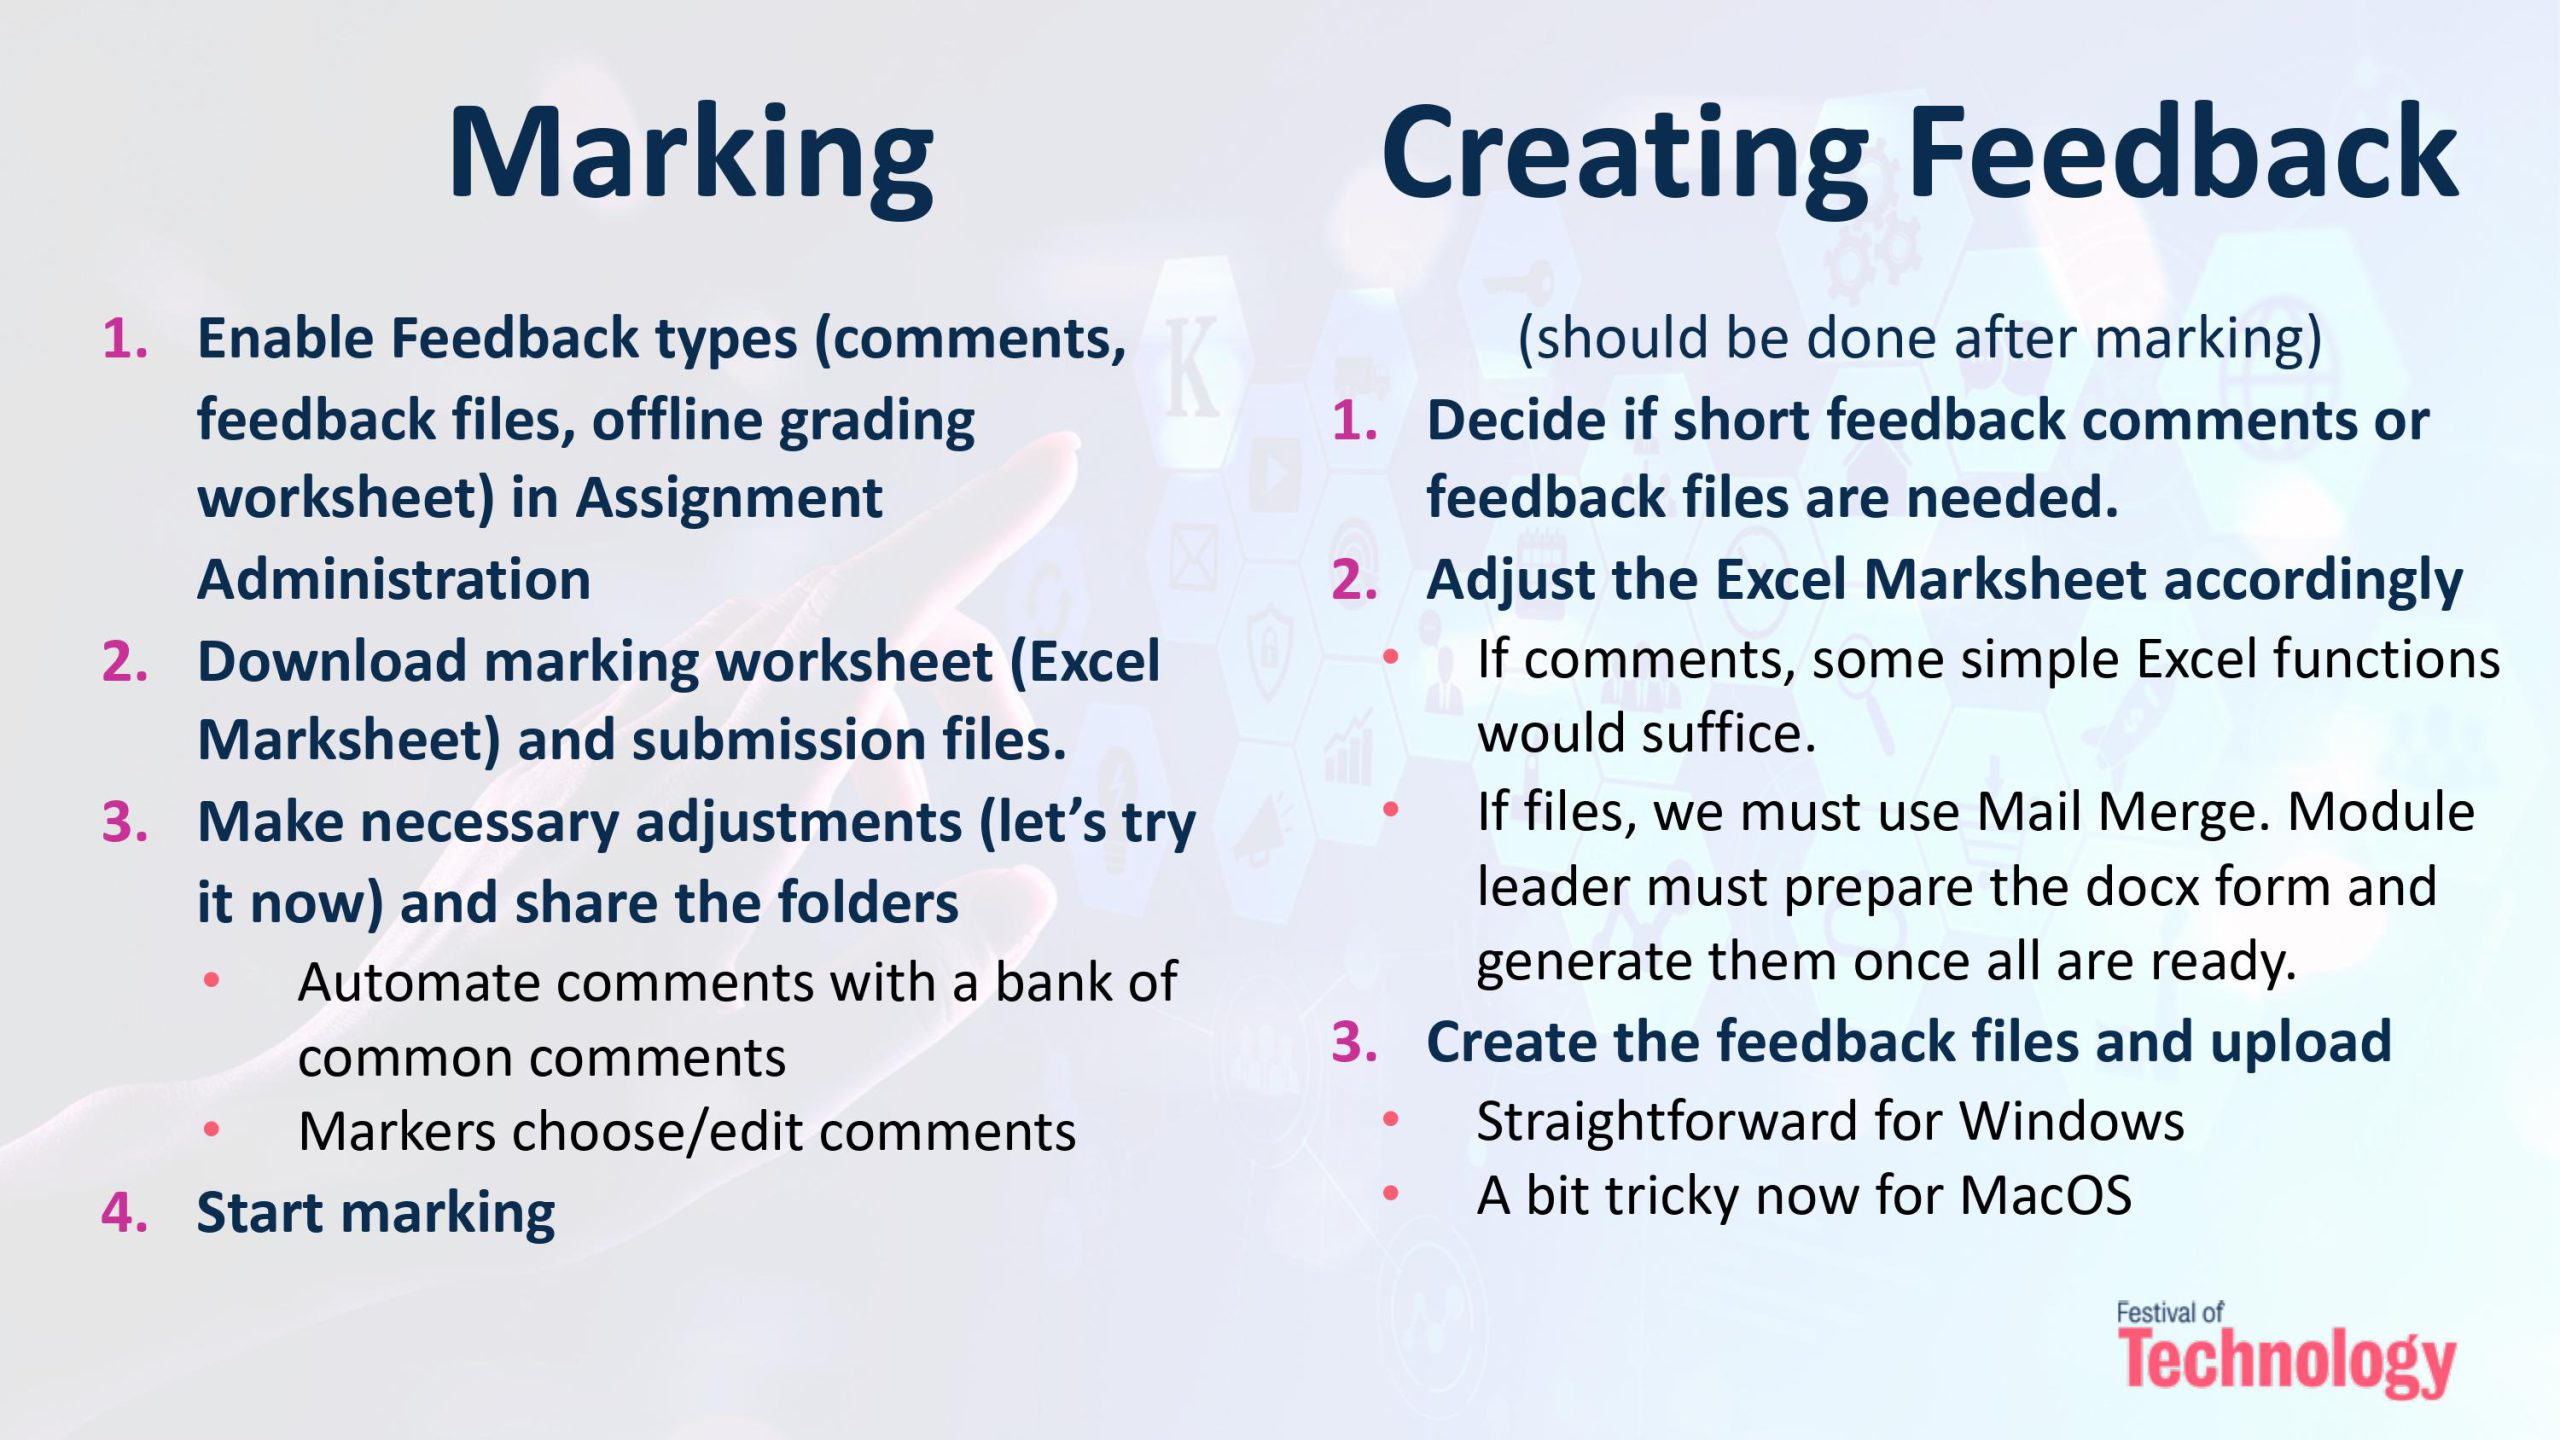
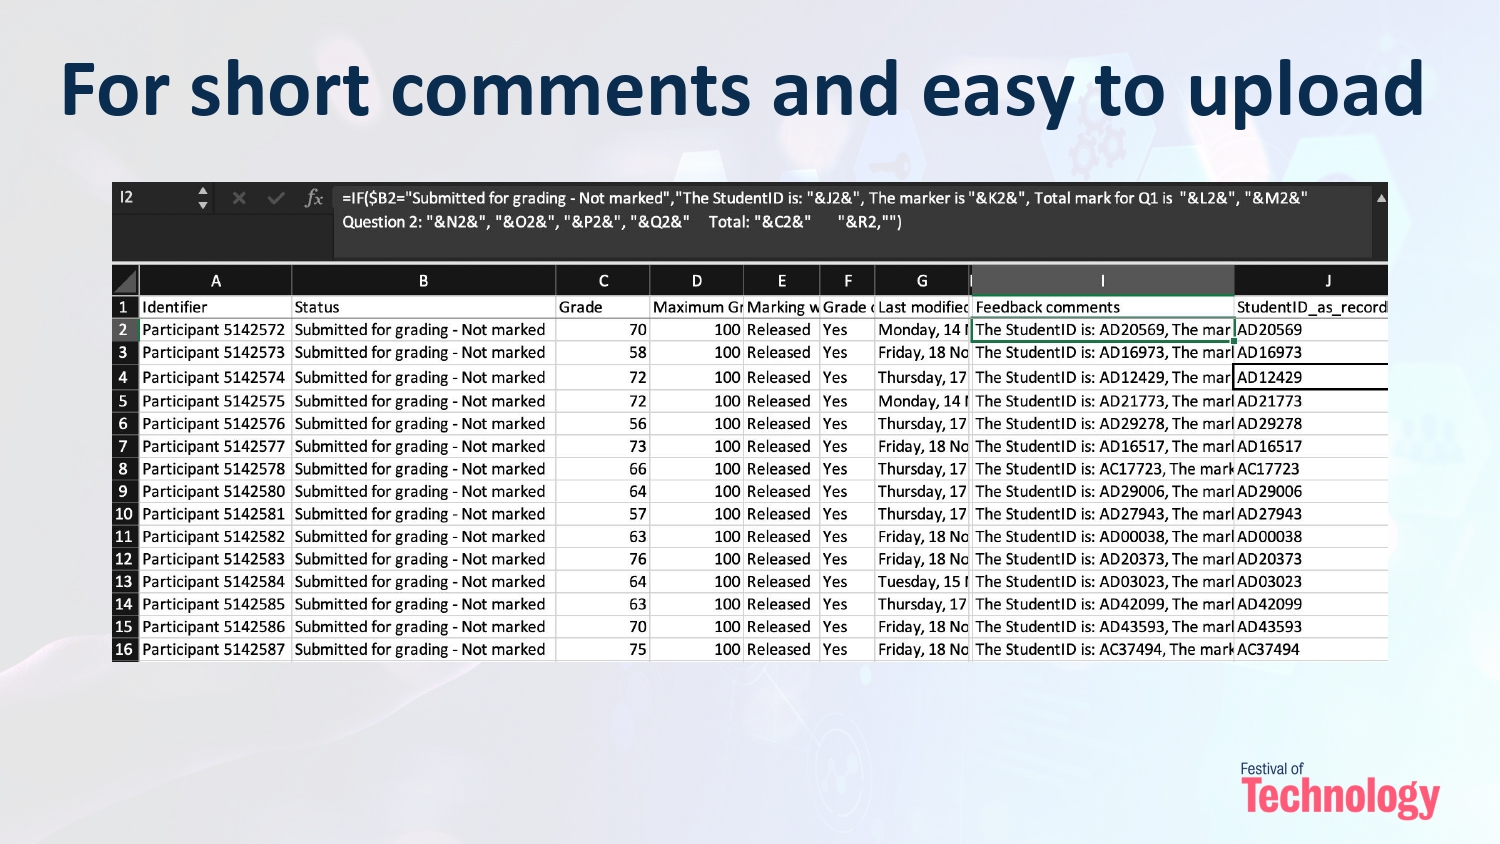
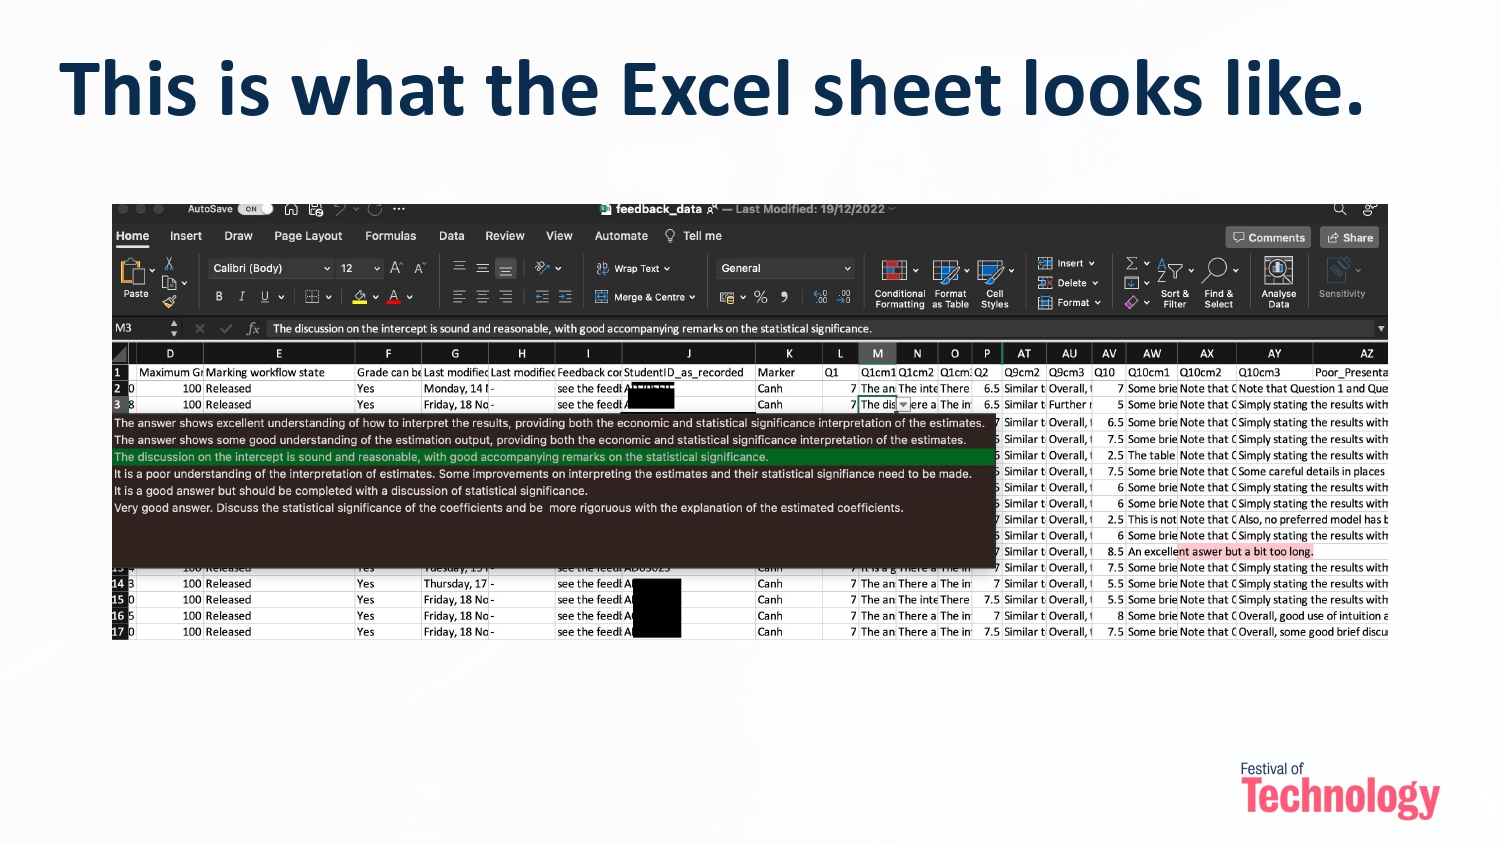
The process involved harnessing the power of Microsoft Excel and VBA Macros within Microsoft Word. These technologies allowed us to streamline and automate feedback delivery. Imagine, no more laborious hours spent typing feedback comments and no human errors involved in exporting and uploading the feedback documents to Keats/Turnitin! Instead, we could focus on providing students with valuable insights to help them excel.
**Challenges Faced:**
Of course, no transformative journey is without its challenges. Some educators were initially resistant to change, finding the prospect of learning VBA Macros daunting. Additionally, ensuring the new system was compatible with various devices and platforms presented a technical hurdle. As I mentioned in the guidance (see from my SharePoint), the set-up and troubleshooting at the beginning can be quite a challenge, particularly for colleagues using the MacOS system (it’s less so for Windows users). Compatibility issues were addressed through rigorous testing and continuous monitoring of system performance. Clear communication with your marking team is also needed to make sure everyone is on the same page with the new system.
But I promise it’s worth the effort and the subsequential usages will be a much smoother sail. And from a marker’s perspective, it is much less work than working through the traditional channels.
The journey from traditional feedback systems to an automated approach using Excel and VBA Macros has been nothing short of transformative. It’s a testament to the power of technology in education, where innovative solutions can overcome challenges and improve the overall learning experience.
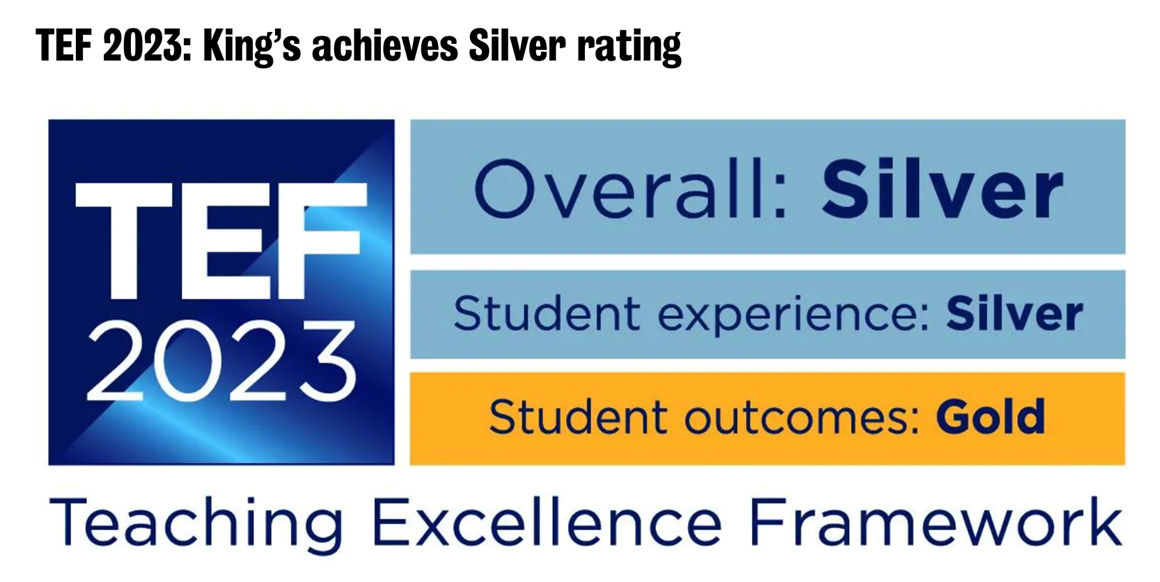
As we continue this path of exploration and adaptation, the future of feedback delivery looks brighter than ever to improved student satisfaction and educational outcomes. I hope that a wider adoption of the process could help deliver a more insightful and time effective feedback to our students, thereby addressing the burning issues identified from the student surveys, as well as helping deliver impacts to the quality of feedback giving and student experience, as identified in King’s Vision 2029 and the TEF framework.
It takes time and communications with colleagues to identify compatibility issues and resolve them. So far, the method has been used by six Economics courses at KBS, two from the University of Glasgow; and colleagues from Marketing and Adult Nursing, have expressed their interests in using it in their courses.
It is definitely not perfect, and I am very much looking forward to feedback, comments, and of course successful implementations of colleagues.
The blog discusses a transformative journey in education, initiated during The Festival of Technology 2022 at KCL. It explores the adoption of Excel and VBA Macros within Microsoft Word to revolutionize feedback delivery. The main reasons for this change were to enhance feedback quality and efficiency, addressing challenges like resistance to change and compatibility issues. Through workshops, ongoing support, and rigorous testing, the adoption of technology resulted in a more efficient, user-friendly, and collaborative feedback system, empowering educators and improving the overall learning experience.
I would like to thank KBS colleagues, Jack Fosten, Dragos Radu, and Chahna Gonsalves for their encouragement, important suggestions and feedback as well as allowing me to pilot the process in their modules. I also thank various colleagues across other faculties for providing feedback and suggestions as well as identifying compatibility issues (with solutions).
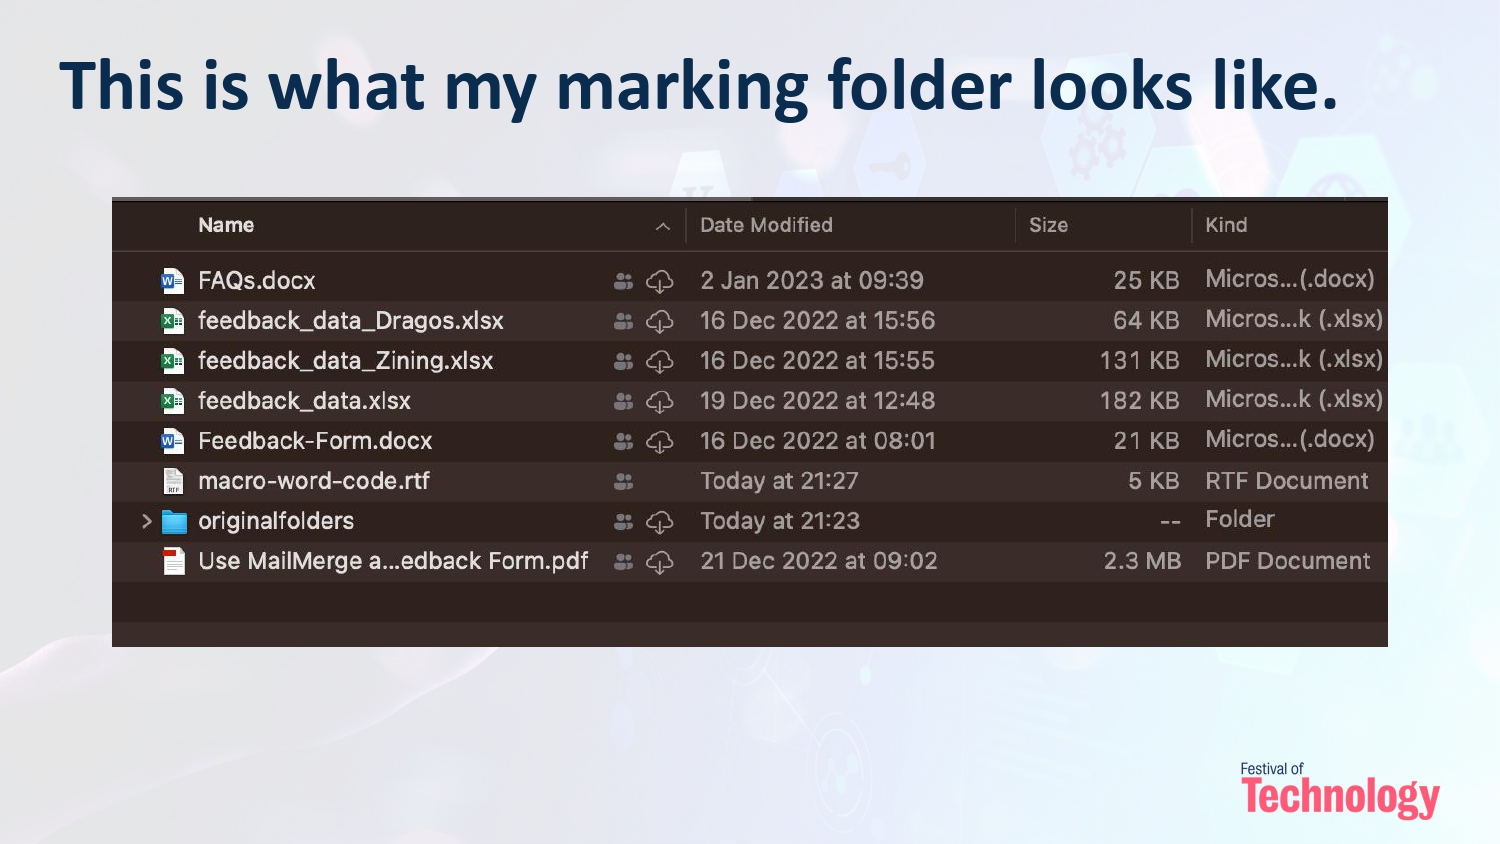
For additional resources, including the workshop slides and a detailed guide with relevant codes and FAQs, please refer to the SharePoint folder linked here.
 I am a Lecturer in Economics at the Department of Economics, King’s Business School, King’s College London. I am also an academic supervisor at the Institute of Finance and Technology, University College of London, and a chief examiner for the University of London International Programme (Econometrics). Before joining King’s, I lectured and conducted research at the London School of Economics as an LSE Fellow in Economics, and at the University of Warwick as a postdoctoral fellow (in Economics). I completed my PhD in Economics at the University of Nottingham in 2018.
I have lectured courses in econometrics and macroeconomics at King’s, LSE, and Warwick, and led seminars (tutorials) in various courses at Nottingham. From March 2023, I am the GTA Lead at King’s Business School.