Evaluation and Reflection, Technologies, Uncategorized

Using Microsoft Power Platform to Support Staff Development

This blog post is a follow-up to the post Using Automation to Facilitate Flipped Learning. 

Due to the success of using Microsoft Power Automate to support flipped learning for an advanced KEATS training session, the Power Automate process was rolled out to all training sessions offered by Centre for Technology Enhanced Learning (CTEL) and other elements of the Microsoft Power Platform have been introduced. This blog post will outline the processes, successes, and challenges. 

Rollout of Power Automate Process 

Once the decision was made by the CTEL CPD Chair to roll out the Power Automate process to all CTEL training sessions, we needed to decide how this would work practically. The established process, or flow, used for the KEATS: Personalising the Learning Experience training session was built specifically for that session and was the only one that included pre-session work. We navigated around this by creating individual flows for each of the sessions run by CTEL and removing and adding steps as appropriate. The Assistant Learning Technologist for the team and I worked closely with the session leads, customising and creating the flows and encouraging personalisation of their flows to better reflect their sessions, such as adding attachments and editing email text.

Another risk was that the flows would reference the same Microsoft Excel spreadsheet hosted on a SharePoint site, and with multiple people accessing and changing the data, flows could be affected and send out emails at the wrong time. We navigated around this by creating individual spreadsheets and pointing the flows to the relevant spreadsheets for each session, which allowed for further customisation from session leads if desired. 

Flows are usually triggered 2 working days before the session is scheduled, but this can vary if the pre-session work required will take more time to complete. The core template automatically completes 5 core steps when triggered: 

  1. Creates a Microsoft Teams Meeting and invites all attendees to the meeting. 
  2. Sends an email containing further information about the session if needed. This is on a 5-minute delay to allow for any manual intervention should any mistakes be made in step 1. 
  3. Sends an email to participants as soon as the scheduled session is finished containing links to further resources and a request for feedback to be left via the Microsoft Form. 
  4. Sends an email 2 working days to participants after the session has been completed, asking for feedback if it hasn’t been left. 
  5. Sends an email 10 working days after the session to participants to ask if they have attempted any content that was covered in the session and if they have any success stories to share or need any further support. 

The above template is core and session leads can add further steps as relevant to their own flows. Working days are calculated within formulas in the Excel spreadsheet and are utilised to increase the response rate, rather than send emails out over a weekend or bank holiday which can be ignored. 

Displaying Feedback in Power BI 

The Power Automate process outlined above is fairly simple in terms of its structure and aims; it sends out emails at predetermined times based on the date and time of the relevant session, which is calculated in the Microsoft Excel spreadsheet. Each email sent to attendees once the session has been completed contains a link to CTELs feedback form. Once feedback is submitted, it is collected, anonymised, and stored. I designed a Power BI report to display the quantitative and qualitative data submitted to display the impact of the sessions and assist each session lead with making any changes using free text submissions.

An Overview of CTEL Feedback organised by session titles, calendar month and by faculty. The graph on the top-left presents which workshops in order of being given the highest feedback. The graph on the top-right presents volume of feedback given by different faculties. The graph on the bottom left presents the average and highs of how much feedback was given per calendar month. The bottom right graphs show when the drilldown date of workshops and the graph below shows overall feedback of 373 out of 746.
Figure 1: The Power BI report for feedback submitted for CTEL training sessions. Data is organised by session title, calendar month, and by faculty. 373 pieces of feedback were left for 2021/22.

After organising this data and gaining experience in Power BI, I was able to link this data to attendance data extracted from SkillsForge, to gain insights into our historical CPD attendance and how this relates to our feedback submissions. An advantage to this was to see if the flows had an impact on gathering feedback for our sessions.

Figure 2 presents the attendance of CTEL training sessions. Organised by calendar month, attendance type by sessions, and by faculty. The graphs on the top left present the overview of attendance of 2021/2022 Academic Year. With 1243 total sign ups out of 2486 and 166 number of sessions. The bottom left graph shows signups by workshop over time by index per month. The top-left graph shows signups by faculties ranging 0-200+. The bottom left graph shows attendance types by sessions of each workshop.
Figure 2: The Power BI report for attendance at CTEL training sessions. Data is organised by calendar month, attendance type by sessions, and by faculty.

Key findings revealed that attendance for 2020/21 was significantly high with 2209 members of King’s staff signing up for a session offered by CTEL, with feedback submissions at 324, so around 14.7% of attendees left feedback. Attendance dropped for the year 2021/22 with 1247 members of King’s staff signing up for a session. This is to be expected as we saw an increase in face-to-face teaching taking place and there were fewer modules delivering fully online teaching, but feedback submissions increased slightly with 373 submissions, around 30% of attendees submitting feedback. This is a positive revelation as although attendance figures fell by almost three quarters, the total amount of feedback submitted increased, and the percentage rate doubled. However, we need to be aware of several caveats with this data.

Figure 3 shows a stacked graph of bookings against feedback submissions for the academic years 2020/21 and 2021/22. With 3456 Bookings, 697 feedback submissions and 20.17% percentage.
Figure 3: Data displayed in a stacked bar graph of bookings against feedback submissions for the academic years 2020/21 and 2021/22.
  • As previously mentioned, the teaching in the academic year 2020/21 was delivered fully online. 2021/22 saw a gradual increase in face-to-face teaching from January onwards, so this data isn’t 100% comparable due to a significant change in circumstances.
  • CTEL ran a total of 29 ‘Breakout Rooms in Microsoft Teams Meetings’ training sessions in 2020/21 with 861 sign-ups, which massively increases attendance data for that academic year. 719 sign-ups occurred in September alone. Breakout rooms were a highly desirable feature of Microsoft Teams Meetings, but the functionality was not robust enough to be rolled out en masse, which may have impacted feedback submissions.
  • As digital capabilities in King’s staff increased throughout the months of the pandemic and demands on staff members’ time have reduced, this may have resulted in more time to engage with and submit feedback.

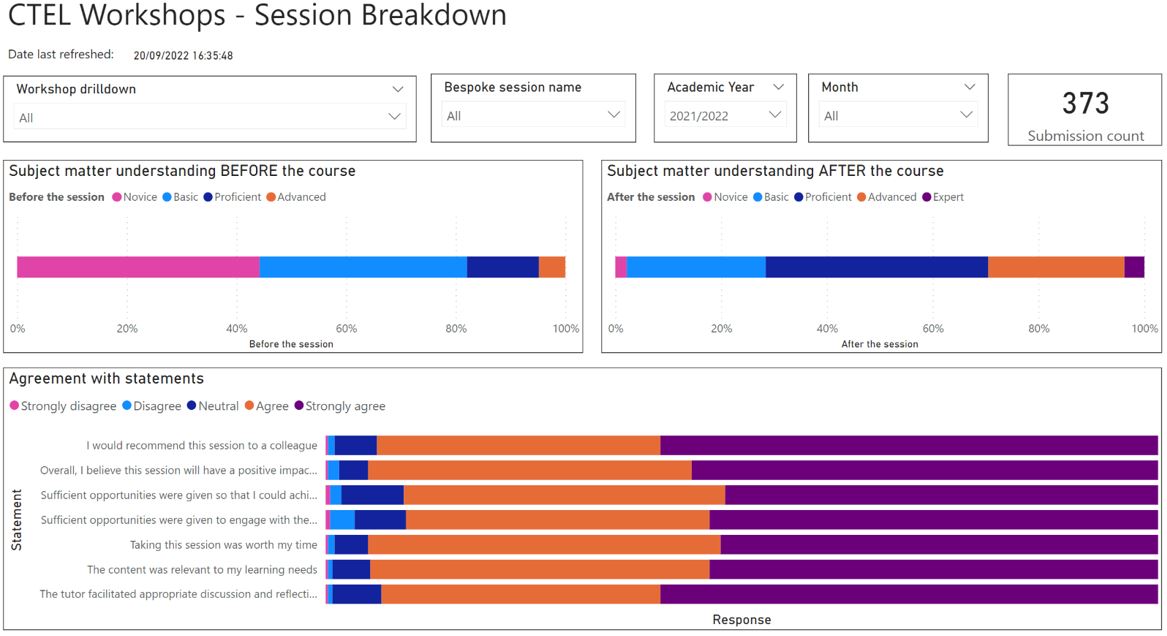
During the academic year 2020/21, CTEL joined other departments across King’s to offer a full suite of training opportunities in delivering teaching online. During that time, a generic feedback form was sent to attendees which were mainly concerned with joining instructions to Teams Meeting links, so we cannot see detailed responses to questions usually asked on the CTEL feedback form. Based on the 373 feedback responses submitted in 2021/22:

  • ~94% agreed or strongly agreed that they would recommend a CTEL training session to a colleague
  • ~95% agreed or strongly agreed that the session they attended will have a positive impact on their teaching.
  • ~95% agreed or strongly agreed that taking the session was worth their time.
Figure 4 shows feedback of workshops for 2021/22. The top left graph presents subject matter understanding before attending the course. With the factors measuring from novice, basic, proficient and advanced. The top right graph presents subject matter understanding after attending the course. With the factors measuring from novice, basic, proficient and advanced. The bottom graph presents agreement results from selecting different statements. Ranging from strongly disagree, disagree, neutral, agree and strongly agree.
Figure 4: Data displayed for 2021/22 quantitative questions.

The above is very positive as it demonstrates the impact that CTELs training sessions are having across the King’s community. The feedback form has not been changed for the academic year 2022/23 and so data can be easily compared in the future.

Based on an overview of the data, the Microsoft Power Automate process appears to be working well as the feedback response rate has remained steady as attendance figures have dropped, and Power BI has been a very useful tool to display and filter feedback data. Session leads have fed back that the Power BI report is beneficial and allows greater insight into the feedback for their sessions, and the CTEL CPD Chair has passed on positive feedback regarding the overall attendance data visualisations. I am currently working on an additional Power BI report that will utilise row level security to allow Technology Enhanced Learning Managers across the university to see attendance figures for their own faculties and tailor demand or promote courses that CTEL offer at strategic points in the year.

I am pleased that the automated process works and has helped free up time for CTEL staff and helped increase our feedback response rate, but I am dissatisfied that the session leads need to access two pieces of software (Microsoft Excel and Microsoft Power Automate) to get this to work. I am currently investigating whether I can achieve the same results with a Power App (another Microsoft Power Platform application) to improve usability and increase satisfaction.

Useful Links:


Written by Dave Busson-Crowe

Dave Busson-Crowe is a Learning Technologist at the Centre for Technology Enhanced Learning and has been involved with Learning Technology in some capacity for approximately 6 years.

He has a keen interest in the use of artificial intelligence in education.

MLC Accessibility 1
Evaluation and Reflection

King’s Language Centre Approach to Digital Education Accessibility

A holistic approach was adopted by the King’s Language Centre (LC) to comply with the legal requirements of accessibility. The Senior Leadership Team (SLT) has been instrumental in driving the change not only with the academics, but also with members of the Professional Service team (PSS). The approach combined top-down and bottom-up strategies that have been successful in improving all our digital resources, including KEATS pages, educational materials, and templates for essential documentation.  Continue reading “King’s Language Centre Approach to Digital Education Accessibility”

Evaluation and Reflection

Part 2: Embedding Digital Accessibility to the heart of everyday TEL work

This article has been divided in two parts. Part 1 discusses how the SSPP TEL team works to boost staff understanding of digital accessibility baseline. Part 2 provides an overview of the TEL training sessions available on the subject.


Part 2: TEL training sessions

The TEL Hub digital accessibility section is aimed at staff to access information in order to meet the basic requirements of digital accessibility baseline from a more administrative perspective. Continue reading “Part 2: Embedding Digital Accessibility to the heart of everyday TEL work”

Evaluation and Reflection

Part 1: Embedding Digital Accessibility to the heart of everyday TEL work

This article has been divided in two parts. Part 1 discusses how the SSPP TEL team works to boost staff understanding of digital accessibility baseline. Part 2 provides an overview of the TEL training sessions available on the subject.


Allyship:

“the state of being an ally (= a person who helps and supports somebody) to a particular group of people that you yourself do not belong to, in order to help ensure their basic rights and ability to be happy and successful in society”- Oxford learner’s dictionary

What does digital accessibility mean to me? It means being able to embrace a platform for its intended use, because the people building it know how to create a great user experience – anticipating, rather than reacting to the needs of our diverse learning community. Being an ally. Continue reading “Part 1: Embedding Digital Accessibility to the heart of everyday TEL work”

Echo Scheduler
Evaluation and Reflection

Part 2: Reflections on collaboration/cross-institutional working in response to and after Covid-19

This article has been divided in two parts. Part 1 explains the online teaching challenges created by Covid-19. Part 2 presents the outcomes and conclusions after 2 years  teaching online.


The volume of shared working, and working through a time of crisis, has helped to build collegiality, camaraderie and significant trust between teams. I believe this is evidenced by the devolution of central services to Faculty TEL teams (and not solely explained by capacity reasoning). For example: the provision of the Echo Scheduler role, Syllabus+ access being extended to TEL; and hopefully – successful pilot permitting – the Kaltura Management Console Super User role.   Continue reading “Part 2: Reflections on collaboration/cross-institutional working in response to and after Covid-19”

Kaltura Managemetn Console
Evaluation and Reflection

Part 1: Reflections on collaboration/cross-institutional working in response to and after Covid-19

This article has been divided in two parts. Part 1 explains the online teaching challenges created by Covid-19. Part 2 presents the outcomes and conclusions after 2 years  teaching online.


Covid-19 forced almost all teaching online in extremis and for an extended period of time. This was followed by at least a year of crisis management; attempting to continue to deliver the core functions of the College in the face of a global pandemic. Almost overnight TEL went from a support function to being of central importance to teaching and learning.  Tools that may have been peripheral became, in effect, core. New tools rapidly became universal. The barriers between the substance of teaching and its delivery mechanisms began to dissolve. IT and TEL colleagues deserve immense credit for the way they managed the sudden massive increase in demand for their services, time and expertise. With the crisis period of the pandemic hopefully in the past, we can now reflect on the enhancements that have come about in our working practices, whether these were created or accelerated by necessity and which we choose to keep for the future. Some of the observations below are concrete, others are my personal reflections or opinions voiced by colleagues. Continue reading “Part 1: Reflections on collaboration/cross-institutional working in response to and after Covid-19”

Evaluation and Reflection

Preparing students for success in the digital world- The process of creating the Essential Digital Skills Programme

Digital competence and confidence are thought to be critical for success in higher education. However, despite a significant proportion of learning being online and evidence to counter the idea of digital nativity, these critical skills are often not explicitly taught at university. The COVID-19 pandemic outlined why it is so important for students to have the digital capabilities required to thrive in their academic, personal and professional lives. This blog reflects on the process King’s College London went through to create the Essential Digital Skills programme.   Continue reading “Preparing students for success in the digital world- The process of creating the Essential Digital Skills Programme”

Evaluation and Reflection

Gauging student engagement and understanding remotely – some tried and tested methods

The rapid pivot to a re mote education format during the 2020 pandemic, necessitated an agile approach to teaching and assessment. With bioscience class sizes ranging from ~25-720 students, ascertaining how well students understood taught concepts, was an essential yet challenging task. Despite the diversity of class sizes and subject areas, some tried and tested methods were found to be more effective and user friendly, for both our students and staff. Continue reading “Gauging student engagement and understanding remotely – some tried and tested methods”

Evaluation and Reflection

Lessons learned and looking forward: reflecting on online assessment in the IoPPN during the COVID-19 pandemic

The COVID-19 pandemic resulted in the university cancelling all in-person examinations and offering alternative online exams. As a collaboration between the IoPPN and King’s Academy, we wanted to gain a snapshot of the impact these changes had on PGT students.  The focus at King’s is often on UG students and so we wanted to explore the views our PGT students across a number of programmes. As King’s considers a move towards more online submission and marking of coursework, the introduction of alternative assessments in a digital format and, of course, the use of online examinations software tools, we hope that this data on what students think and feel and think about the approaches taken during 2020 will help inform the best way forward.  Continue reading “Lessons learned and looking forward: reflecting on online assessment in the IoPPN during the COVID-19 pandemic”

Microsoft Teams
Evaluation and Reflection

Education Elevenses – colleagues who teach face the pivot online together

Education Elevenses are faculty-wide, peer-led, centrally supported regular meetings in which colleagues share practice and ideas about the pivot to online teaching. Continue reading “Education Elevenses – colleagues who teach face the pivot online together”