
Nearly all human traits, such as height, weight, and intelligence, and common disorders like major depressive and anxiety disorders are polygenic. This means that variation in more than one gene (usually many genes) contributes to total genetic predisposition for a specific trait or disorder. Chris outlines how Polygenic Risk Scores can be used to capture this variation.

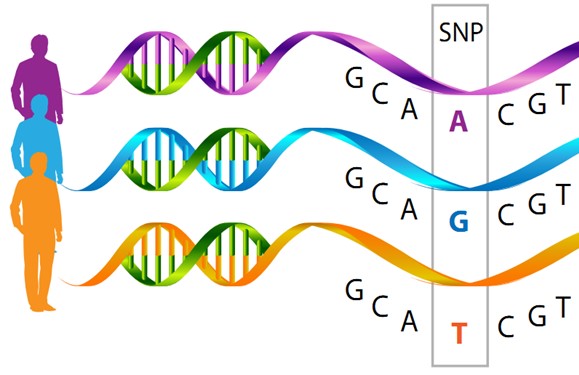
The human genome is a sequence of approximately 3.2 billion pairs of nucleotides (A T or C G), the basic structural units of DNA. One percent of this sequence codes for approximately 20,000 genes. Genes are expressed as proteins, which work together in networks, to perform specific functions. Single nucleotide polymorphisms (SNPs) are DNA base changes (e.g. C replaced by G), which add variation to DNA between individuals. Most of the time, these changes have small (nearly negligible) effects on gene function or expression.
However, a decade of genome-wide association studies indicates that the combination of multiple genetic variants (single base changes A, T, C or Gs) can influence complex polygenic traits, each with tiny additive effects. A polygenic score (or polygenic risk score [PRS], genome-wide polygenic score [GPS], genetic risk score [GRS]), is a way of summarizing these multiple genetic effects into a single score. Usually this is simply the sum of the trait-associated genetic variants (SNPs) that an individual carries, weighted by the estimated effect size of the variant (these effect sizes are estimated from a genome-wide association study for the specific trait). The total score can be used to summarize an individual’s common genetic predisposition for a specific trait.
“A polygenic score… is a way of summarizing these multiple genetic effects into a single score”
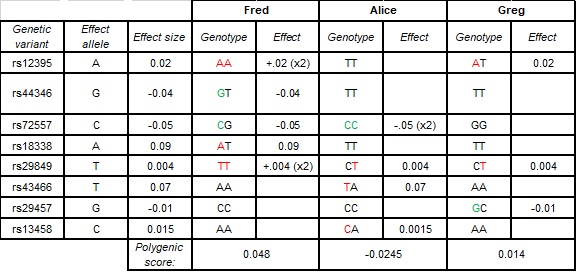
At each location in the genome, an individual inherits one allele (A C T or G) from their mother and one from their father, to make up their genotype (i.e. maternal allele = C; paternal allele = T; genotype = CT). Therefore, for each SNP, an individual can carry one or two copies of the effect (trait-related) allele. When calculating polygenic scores, the effect at each SNP is multiplied by the number of copies an individual has (remember, maternal + paternal = genotype). For further illustration, see the table below.
Genome-wide association studies approximate the effects of up to ~10 million single genetic variants on a specific trait. Each genetic variant will have an estimated effect size, an error term (how uncertain the estimate is) and a probability value (indicating how likely the association is to be true). Different approaches to calculating polygenic scores look to improve prediction accuracy by choosing what SNPs to include (e.g. include SNPs with higher likelihood of having a true effect via p-value thresholding) or by shrinking the estimated effect size to be closer to the true effect size (based on the error term and the distribution of effect sizes).
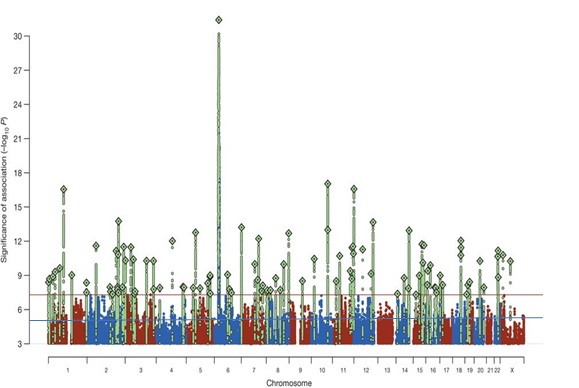
The flagship GWAS for psychiatry, the 2014 Psychiatric Genetics Consortium schizophrenia paper, identified 108 genetic variants with statistical significance. The green peaks represent SNPs that are associated with schizophrenia at a genome-wide level of statistical significance (p < 5 x 10⁻⁸; indicated by the red line). The blue line represents the threshold for suggestive significance (p < 1 x 10⁻⁵). Polygenic scores can be calculated by including only those SNPs associated with genome-wide significance, SNPs associated at a suggestive level significance, SNPs at conventional statistical significance (p < 0.05), or they can include all genome-wide SNPs. In this paper, genome-wide significant SNPs explained 3.4% of the variance in schizophrenia case-control status, whereas SNPs at conventional significance explained 7% of the variance. From: Biological insights from 108 schizophrenia-associated genetic loci
Usage of Polygenic Risk Scores
In samples of participants where DNA data is available, polygenic scores can be calculated for any trait that has a sufficiently statistically powered GWAS. Once polygenic scores for a trait have been calculated, they can be plotted against phenotypic values for the same trait or a related trait to estimate how much of the phenotypic variance in trait 2 can be explained by common polygenic variation associated with trait 1.
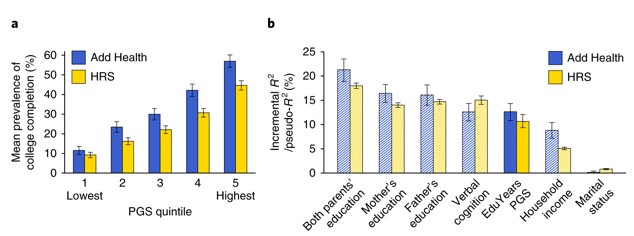
Polygenic scores are beginning to explain more variance in related traits as GWAS sample sizes are increasing. For example, a recent polygenic score constructed from a GWAS of >1 million individuals explains 11% of the sample variance in educational attainment. Furthermore, when grouping individuals into quintiles based on polygenic scores, on average only ~10% of individuals within the lowest quintile of polygenic scores complete college education, whereas in the highest quintile about 50% of individuals complete college education. However, the authors of this paper stress that polygenic scores are still unsuitable for individual level prediction. Although on average those with a higher polygenic score have a higher phenotypic score, there is still a lot of variability.
At the moment Polygenic Risk Scores cannot be used to inform about an individual’s predisposition or risk for a trait or disorder. However, one possible future use of such scores would be for example that individuals with a very high polygenic score for a specific disorder are offered more regular screening. Or that polygenic scores might be used alongside other patient characteristics in treatment prediction models that combine genetic and non-genetic information (more on this in T for Therapygenetics).