
What is it?
Visual organisers are ways in which material (concepts, facts, ideas) can be represented in a visual format. They have roots in Ausubel’s cognitive learning theory (Ausubel, 1960) and were originally known as ‘advance organisers’ (to show in advance the relationship between different aspects of the topic). Examples include showing a sequence as a flowchart or a classification system as a tree structure, rather than just describing them in words. Visual organisers can also provide structures that can help students compare and contrast, learn about cause and effect, classify, relate information to themes, or sequence material. Concept maps are one type of visual organiser.
Why do it?
Visual organisers provide visual scaffolds that have positive effects on student understanding, vocabulary development, acquisition and retention of knowledge across different ages and levels of ability (Manoli & Papadopoulou, 2012). Experts tend to organise knowledge differently from novices so it can be helpful to share experts’ organising schemes with students (Ambrose et al, 2010). Involving students in developing these schemes helps them to make meaning from the material as they learn to select relevant aspects and represent the relationships between them: it also helps teachers to understand their students’ conceptions of a topic (Cooper & Stowe, 2018).
How to set it up
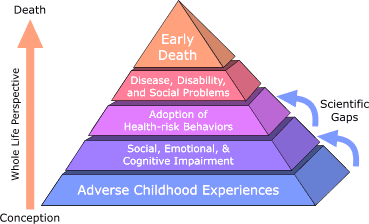
Educators can present a visual organiser at the start or end of a topic to give an overview of the structure of the material, or use it as a reference point throughout a teaching session. You could devise your own graphic organiser or use pre-existing ones. For example, many models or theories are presented in visual form such as the Adverse Childhood Experiences pyramid below.
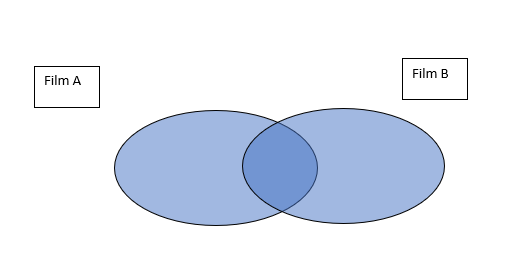
Alternatively students can be given a visual format and asked to complete it – for example annotating a Venn diagram showing the distinct and overlapping themes of two films.
For further formats including circle maps, bubble maps, bridge maps and multiflow maps, this resource on ‘thinking maps’ [PDF format] (Sonoma County Office of Education) describes different types of graphic organiser with examples of how each can be used.
Another option is to allow students time to work out the structure of the material for themselves as a creative or reflective activity. For example, you could have students produce a mind map or concept map (see Assessment for Learning at King’s).
Considerations
Decide whether you want to show students a visual organiser you have already made or found, or provide it as a structure which students can annotate and organise material within, or have them create their own.
For effective use, students need appropriate guidance and support in using pre-prepared organisers or developing their own (Cooper & Stowe, 2018).
Variations
Visual organisers could be produced individually by each student, or by groups of students working together.
They could be a task set outside timetabled sessions – for example students could be asked to read an article and bring a visual/diagrammatic representation to class.
Visual organisers can be drawn by hand or on computer, or you can provide small post-its on which students can write key ideas or concepts and move them around until they find a format that represents their understanding.
Examples and resources
This resource gives lots of different examples of visual organisers and how they have been used.
The British Council sets out a number of different types of graphic organisers and their possible uses.
References
- Ambrose, S. A., Bridges, M. W., Dipietro, M., Lovett, M. C. & Norman, M. K. (2010) What kinds of practice and feedback enhance learning? in: How Learning Works: 7 Research-Based Principles for Smart Teaching, 1st ed. San Francisco: Jossey-Bass (Chapter 2 pp40-65).
- Ausubel, D. P. (1960). The use of advance organizers in learning and retention of meaningful material. Journal of Educational Psychology, 51, 267-272. doi:10.1037/h0046669
- Cooper MM, Stowe RL (2018). From Personal Empiricism to Evidence, Theory, and Informed Practice Chem. Rev., 118, 6053−6087. https://pubs.acs.org/doi/pdf/10.1021/acs.chemrev.8b00020
- Manoli & Papadopoulou (2012) Graphic Organisers as a Reading Strategy. Creative Education Vol.3, No.3, 348-356, (http://www.SciRP.org/journal/ce)
- Sonoma County Office of Education (undated). Aiming High Resource. Thinking Maps. Available from https://www.scoe.org/files/AH_maps.pdf.
Image source: Barilleaux, C. 2014. Sketchnote Handbook 2. Available from: flickr.com/photos/bontempscharly/12882043833 shared under a Creative Commons (BY) licence.
Leave a Reply