
Overview
Dr James Porter leads Environmental Science and Policy Making, a 10-session masters module with 35 students. In his final two-hour session, groups of students visually represent a concept from the module. This takes the form of a tableau – a group of models or motionless figures representing an academic concept as a scene – and a poster. Both are photographed and uploaded to a shared web page. Students then present these in plenary.
Why did you introduce this activity?
To bring the module together, and to check students’ learning in advance of the final assessment. I was looking for a way to refresh students’ perspectives on the wide range of concepts considered in the module, and for a reason for them to practically ground and apply abstract ideas. I thought the tableaux were very promising as an outlet to think critically and reflexively about the relationship between environmental science and policy. I also knew that visual engagement with concepts from across the module would help towards a deeper and more practical understanding of the concepts, and in this respect it was also a preparation for their final assessment. Working in groups would give students the chance to to hone their communication skills and teamwork. I wanted students to develop their visual communication skills since the module already has an oral presentation and different kinds of written work such as policy briefs.
How did you set it up?
By this stage of the module students knew each other pretty well from their seminar discussions and I was confident they would enjoy doing this. I’ve read about tableaux working well with over 150 students (Hauke, 2018), but my group was 35 so it was relatively straightforward to book one room per group, plus a plenary room, as close to each other as possible so that we could easily facilitate. This session brought together three seminar groups, so there were three GTAs to facilitate with me.
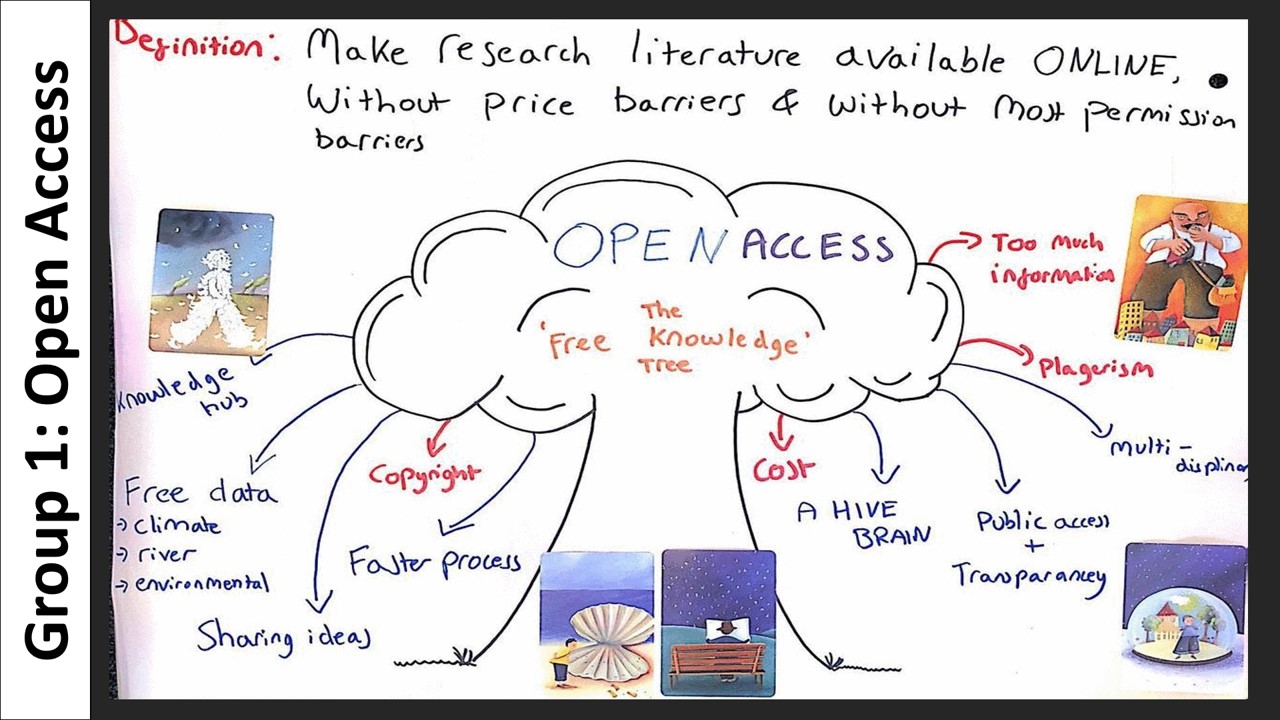
First students would choose a concept (summarised on a slide) including linear model, open access, advocacy, data friction, civic epistemology and others. Then they created the poster in their rooms, after which they went outside to make the tableau. They took photos of each, made them into a gif (we gave instructions) and posted them on a slide in a PowerPoint deck on SharePoint.
The timings for the session were roughly 15 minutes for the introduction, 30 minutes for making the poster, 30 minutes for making the tableau, 30 minutes for the plenary presentations (2-3 minutes each) and the rest of the time for the summing up.
Each group focused on a single concept. We gave them a ‘Making concepts visual’ kit containing instructions, A2 paper, a map of nearby sites which might work well in their photographs, some Starburst sweets, cut-out pictures of the concepts, two pens, and a coin for resolving intractable decisions.
Finally in the plenary students presented their work and the gifs were shown on a loop in PowerPoint. We also set up a vote for the best tableau and a small prize.
How did you introduce it to students?
I introduced the session with a 15 minute lecture tying up the module. Then I summarised the concepts and explained what students would be doing for the following half hour, emphasising the purposes of the exercise and including examples from Imperial College and something I prepared myself. Students were asked to self-organise into groups based on which concept they anticipating using in their final assessment.
The instructions in the kits included what to do and when – the poster came first, as preparatory thinking for the more abstract tableau. Also in the kits were some light-touch ground rules to help groups work well together. We asked them to allocate roles so that every student could participate. There were also timings, locations, and a map of likely tableau sites.
How did you check students’ learning during or from the activity?
We checked on the groups in their respective rooms, and watched each presentation during the plenary.
What benefits did you see?
We initially wondered if this would be feasible – could they actually turn these complicated concepts into a visual? But students produced sophisticated work which drew on their learning and reassured us that they were ready for the final assessment. In the end it’s about having confidence in the students – and the time constraints were helpful in focusing their efforts. The roles and instructions helped the less vocal students to participate and the teamwork was generally good. As hoped, we did manage to check students’ understanding of concepts in advance of essay.
What challenges did you encounter?
There are logistics around gathering the materials, but they are surmountable. There were some specific tech challenges which students managed to resolve themselves. One was different image resolution settings from different phone cameras which needed adjusting before students could make the gifs, and another was related to different versions of PowerPoint interfering with the loop. When it came to recommending locations for the tableaux, we needed to think of wet weather contingencies – interesting spaces nearby where you could gather without disturbing anyone.
What advice would you give colleagues thinking of trying this activity?
Next time I may ask students not to give us the title of their tableau in advance, so we can test its powers of communication. If you’re giving students food, try to go for something the maximum number of people can eat, anticipating different dietary requirements.
Further resources
- To tableau or not to tableau – a detailed account of James Porter’s and Camille Audia’s first tableau at King’s.
References
- Hauke, E., 2018. Case study: active learning design. http://livelovelearn.education/2018/10/29/design-in-action/.
Leave a Reply