
")
By Nadia Chechlińska, Research Associate|
We all know ‘correlation does not imply causation’ – but how do we imply causation? In the second of her book reviews, Nadia explains how ‘The Book of Why’ can help you to accurately attribute causality.
Judea Pearl is one of the most influential scientists in research on causality. In his latest book ‘The Book of Why – The new science of cause and effect’[i] (co-authored with Dana Mackenzie) Pearl describes how thinking about causality has developed to the form we now recognise, with a strong emphasis on the concept of causal inference; the process of analysing the relationships between events in a way that reveals the true causes of a phenomenon, when it can be observed, and most importantly – “Why?”.
Causal diagrams – a tool for visualising causes and effects
The core message Pearl wants to convey is that the world around us is more complex than we realise. We are often tempted to simplify the relationships between phenomena and to attribute cause-and-effect relations when they are absent, and we fail to notice the real cause of an event – even if it is right in front of us. This happens when we want to reduce cognitive effort when making a judgement, and use shortcuts to facilitate fast thinking. To protect us from such biases when designing a study or a project, researchers need to appreciate the pre-requisites for causal inference.
In What Works (WW) we engage in a similar process when creating a Theory of Change, where we outline a cause-and-effect logic chain, propose mediating variables, and consider the assumptions behind our reasoning. At this stage, we hypothesise what the causal relationships are between relevant variables and outline how these will be investigated.
To make this process more systematic and understandable, Pearl proposes a tool for boosting our cognitive abilities when thinking about causality – causal diagrams. In the past, researchers lacked language to talk about causality and therefore their methodology was limited to correlational studies. Causal diagrams are used to visually represent variables and the possible causal relationships between, enhancing researchers’ understanding of causal relationships.
The diagram below is the simplest example of how we could use causal models in WW. It indicates that participation in K+, our flagship outreach programme, causes changes in expected university enrolment rates for K+ students – which is in line with our assumptions.
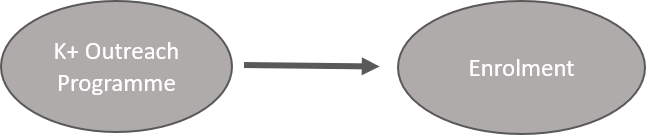
Figure 1
Causal models help us visualise where we can expect a causal relationship, but also where causation cannot be inferred because of limited information. According to Pearl, the main reason for engaging in causal inference is to determine research questions and then to consider what data needs to be collected to answer them. This way, we can acknowledge potential outcomes and limitations before conducting the research.
Pearl’s Ladder of Causation (see picture on the right) is a hierarchical representation of what causal conclusions (if any) can be drawn from a particular set of data.
We can’t make causal inferences with correlation data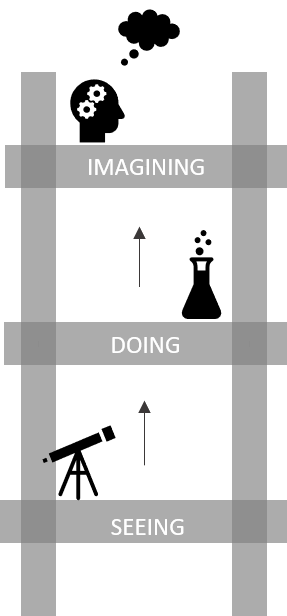
Through seeing different phenomena, we can detect regularities in our environment and adapt accordingly. Pearl argues that association is the bottom rung in the Ladder of Causation – we associate two events if observing one increases or decreases the chances of observing the other. For example, when enrolment at college decreases, the number of teachers also decreases.
Let’s come back to our example from above. After collecting data on the K+ university enrolment rates, you run a statistical correlation and you may notice that you ‘see’ enrolment most often when you ‘see’ participation in K+ programme. In other words, if you observe an increase in K+ participation, you expect to observe an increase in enrolment as well.
However, knowing that K+ participation is associated with higher enrolment rates provides no information about whether the K+ participation is the cause of higher enrolment rates. Cognitively, we are very quick to assign a causal relationship between our correlated variables, but according to Pearl – we cannot make causal conclusions based on simple associations between variables.
Figure 2
Interventions help us detect causal relationships between events
One of the reasons why we may see a correlation between two events, even if they are not causally related, is that they are both caused by a third variable – a confounder. Constructing a causal model helps in detecting confounding variables, because it requires us to think more carefully about the phenomena relevant to the variable of interest. If we want to measure whether it is the K+ programme that causes an increase in enrolment, we need to do more than analyse passively collected data – we need to intervene with the reality.
Intervention, which is a second rung up the Ladder of Causation, is a method of testing whether the causal relationship between variables is real or illusionary (caused by an extraneous variable). To this aim, researchers carry out experiments in which they perform an action while making sure the potential confounders (observable and latent) stay constant.
Causal models help in performing an intervention mentally before performing it in real life. Visualising the relationships between the K+ programme and enrolment helps us better understand the whole process of an intervention, what results one may expect, and what conclusions can be drawn.
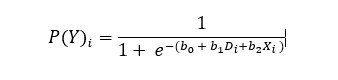
What Works supports other departments in statistical evaluation of their projects. To show what we do with their data, we present them with a statistical formula (see below). Here we try to explain algebraically how the extraneous variables (confounders; Xi – e.g. previous attainment) affect the variables of interest (Y – enrolment rates).
Now let’s see how Pearl’s causal models help us express the same relationships visually:
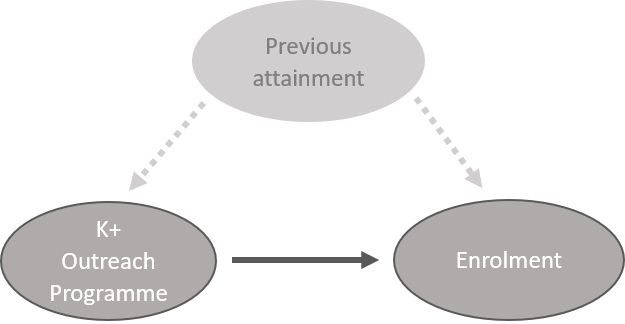
Figure 3
Here we can clearly see and explain that previous attainment is a confounding variable, which affects both K+ participation and enrolment. If we see that the group in the K+ programme was more likely to enrol into university than the control group, when statistically keeping previous attainment constant, we can conclude that the two events are causally related (this is simplified, in reality there are many potential observable and latent confounders).
A common tool used to run interventions is the Randomised Controlled Trial (RCT). The main idea behind the RCTs is that we randomly assign participants to two conditions, collect data from both groups, and only then compare them and draw causal conclusions (as in the example above). This is the only intervention design which ensures control over confounders but is also a one which is not always possible to run. There are cases in which randomisation is difficult or impossible – and this is where the causal models are particularly useful in determining potential confounding variables.
Moving on to the “Why” question
In research, however, we often want to know more than that – we want to understand why we observed the causal relationship between variables. To do so, we need to think about counterfactuals: if something had been done in a different way, would we have achieved the same situation? It is not the same as comparing a treatment group to a control group, because counterfactuals are considered only after we know the results of our actions (e.g. interventions). When considering counterfactuals, we can only make guesses and imagine the alternative world, because we are not able to go back in time and actually change the past.
Our guesses are based on some assumptions and these assumptions are reflected in a form of a causal model. Controlling for confounders and manipulating a single variable is not enough to make accurate guesses about the alternative worlds. We simply need more data, which can give us more clues about the past to better predict the alternative future. Pearl proposes using a mediation analysis, which allows us to account for indirect effects of our action in an intervention, but it requires collecting additional data.
In What Works, we already account for mediators at the stage of constructing a Theory of Change. We measure the short-term outcomes and hypothesise that they mediate the long-term impacts of an intervention, which makes causal and counterfactual inferences more accurate. For example, imagine that besides the enrolment rates (long-term impact), researchers also collected data on student’s self-efficacy (short-term outcome) and included them in the causal model (see below).
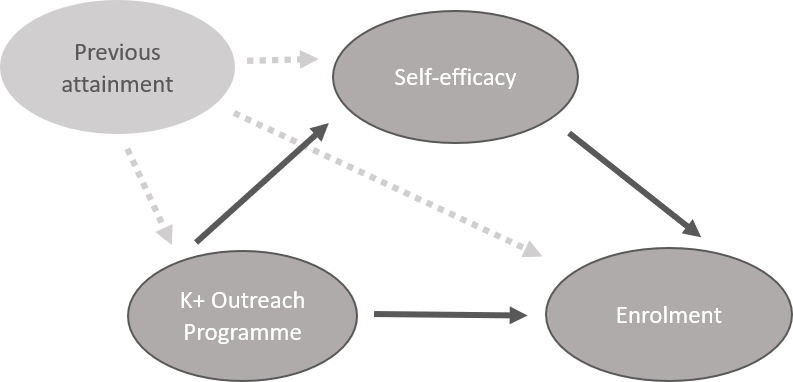
Figure 4
Figure four illustrates that K+ programme causes an increase in self-efficacy, which in turn causes a change in enrolment rates – now the counterfactuals are easier to reason about and we are much closer to understanding why the causation occurs.
Climbing up to the top of the ladder of causation allows us not only to detect the cause-and-effect relationships but also enables us to place our research question in a broader context and understand it better.
Conclusions
The main lesson from Pearl’s book is that prior to analysing or even collecting data, we need to realise what causal questions we really want to ask and what type of data we need to answer them. In What Works, we encourage practitioners to formulate research questions, plan methodologies, and create analytical strategies through a Theory of Change and/or research protocols. We believe that this way we are one step closer to finding out what are the true causes of phenomena we investigate, and how we can use this knowledge to design the most effective behaviour change in the future.
_______________________________________________________________________
Click here to join our mailing list.
Follow us on Twitter: @KCLWhatWorks
[i] Pearl, J. (2019) The Book of Why: the new science of cause and effect
Leave a Reply