Susannah Hume and Michael Sanders, King’s College London and Behavioural Insights Team |
In the KCLxBIT project we asked respondents at two time points what grades they expected to get over the coming year – they could select First, 2:1, 2:2 or Third. The first time was in September 2016, reflecting their expectations for their achievement in first year, while the second was in July 2017, reflecting their expectations for their grades in second year.
Since they had received their exam results by the time they responded to our expectations question for the second time, we were interested in whether they updated their expectations based on their achievement in first year, and if so, whether some students were more responsive to new information than others (see below for graphical representation of timing).

Note that this analysis is based on the students who completed the Pulse Survey, not the full King’s population.[i]
As we expected, this analysis yielded some interesting insights. We found that:
- Mainly, the students expected to get 2:1s, with males leaning more towards expecting higher grades, and BAME females leaning more towards expecting lower grades. 41% of BAME males expected to get a First, and over 93% expected to get a First or 2:1, compared to around 80% of respondents in other groups (Chart).
- Between first and second year, in general, white respondents got a bit more optimistic, while BAME students stayed about where they were, and more BAME students adjusted downwards than white students (Chart).
- As far as actual grades go, the modal outcome for all Pulse students was a 2:1 (towards the lower end for females and upper end for males).[ii] White males skewed higher than other groups, while more students from BAME backgrounds received average grades below 40, but also, more male BAME students received very high marks. (Chart)
Unsurprisingly, all students are responsive to their actual grades in developing their expectations for second year. This chart plots the relationship between the difference between expectations and actual grades (a different of one ‘grade’ here being the difference between a First and a 2.1 or a 2.1 and a 2.2, etc) and the change in their expectations for first year and second year.[iii] As expected, we see the line sloping upwards – that the better someone does in first year the better they expect to do in second year.
However, a common finding in behavioural science is that we respond differently to good vs bad news. For instance, students might get more demoralised by a worse grade than they are encouraged by a similarly better grade because of loss aversion; or conversely, they might be inclined to write off a bad result as a once-off, but assimilate a good result into their views about themselves as learners. Self-serving bias describes our tendency to attribute bad events to external factors and good events to their own qualities. This is a powerful psychological defense mechanism designed to protect our self-esteem (failure of the self-serving bias can be a feature of depression[iv]), but which, of course, has drawbacks. If we can’t accept our own role in our failures, we can’t learn from them.
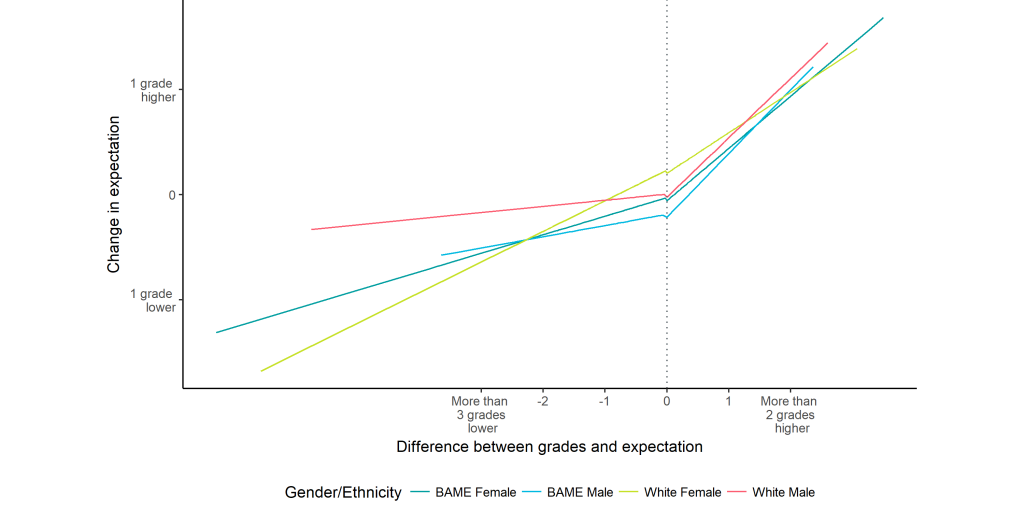
In the chart below we plot the relationship again, but allowing the slope of the line to vary on either side of the 0-point (which denotes a score at the midpoint of the classification the student expected). This time, we also break the results down by gender and ethnicity. The steeper line to the right hand side of the 0-point means that students were more responsive to positive news than to negative news.
We see this particularly for white males in our sample, who showed almost no updating of their expectations even when they did much worse than they expected, and strong responsiveness to doing better than expected. White females, meanwhile, were pretty consistent in the way they translated positive and negative news into new expectations, and no groups were more responsive to negative information than positive information.
This is good news because it suggests that most respondents who did worse than expected did not become demoralised–particularly if they were white males–instead they expected to get back on track in second year and achieve their goals. However, it does raise the question of whether these students are changing their behaviour in ways that will help them achieve their expectations in future.
Click here to join our mailing list.
Follow us on Twitter: @KCLWhatWorks
______________________________________________________________________________________
[i] Where the analysis involved initial expectations and/or Grades, it is on all Pulse survey respondents; where it involves updated expectations, it is Wave 6 respondents only (see table below). Analyses have not been population weighted, so caution should be used when generalising to the overall population. In addition, the analysis presented in this post does not control for other factors, such as age, faculty, or WP status.
| Group | Number in Pulse survey | Number in Wave 6 |
| BAME Female | 234 | 149 |
| BAME Male | 115 | 57 |
| White Female | 289 | 184 |
| White Male | 131 | 75 |
| TOTAL | 769 | 465 |
[ii] Pulse participants had a slightly, but significantly, higher average grade than the overall population (by about 2 marks) – this is largely driven by a higher proportion of Pulse respondents receiving Distinctions.
[iii] We do not break down below the overall BAME/white binary owing to the sample size.
[iv] Greenberg, J., Pyszczynski, T., Burling, J., & Tibbs, K. (1992). Depression, self-focused attention, and the self-serving attributional bias. Personality and Individual Differences, 13(9), 959-965.


Leave a Reply