This case study is from Dr Chiamaka Nwosu, Lecturer in Policy Evaluation at King’s College London. Chiamaka teaches a core module on Research Methods to 40+ students enrolled in the MSc in Management and Technological Change programme. The format is a 3-hour workshop which prioritises hands on, collaborative group work.
What is it?
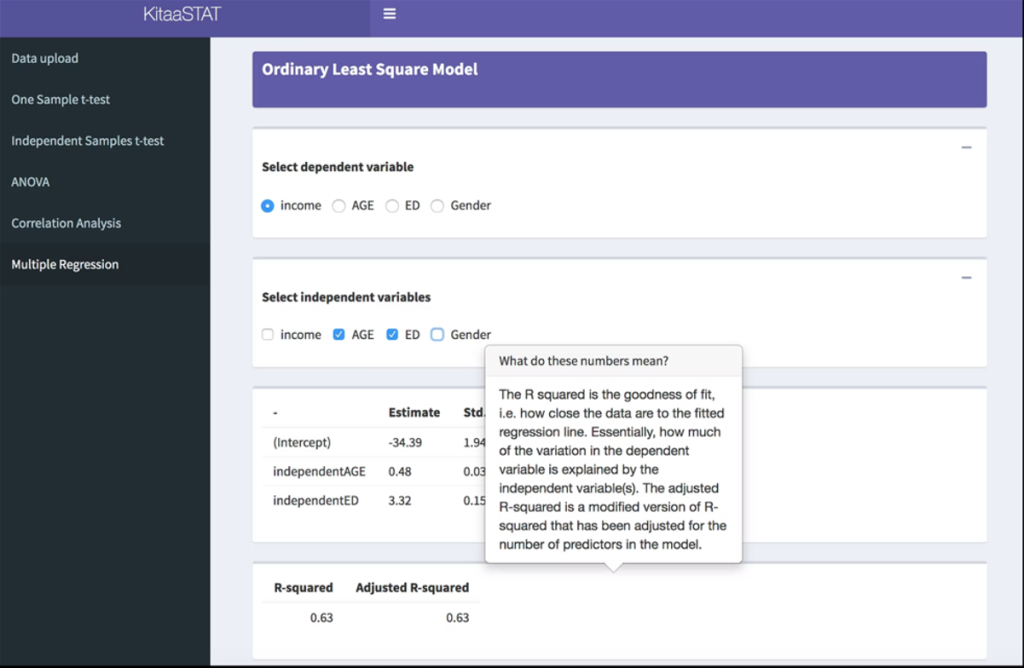
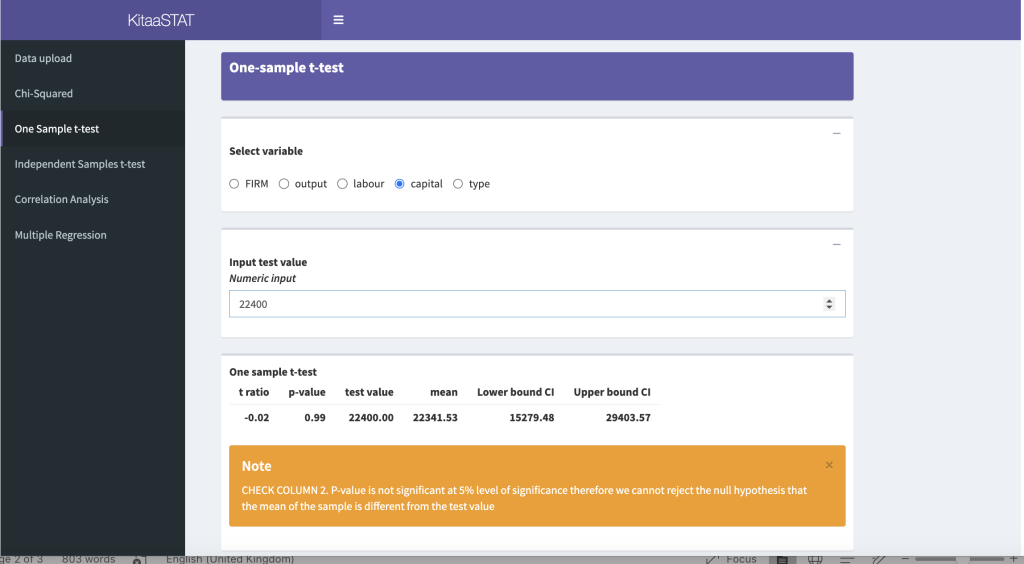
KitaaSTAT is a web-based statistical software package I developed which makes it easier to understand the results from correlations, hypothesis tests & regressions which is helpful for beginners to statistics. Users can begin their data analysis by simply uploading a dataset and then selecting a statistical test to use to analyse the data e.g., a chi-squared test or a one sample t-test without requiring any coding syntax. The software was developed by creating a series of coding scripts in R (a software environment for statistical computing and graphics) to build the user interface with the bulk of the calculations being carried out on the backend. It also includes tooltips and pop-up alerts which provide guidance to the students by explaining the results from these statistical tests.
Why did you develop the software?
The Research Methods module is a compulsory module which is delivered as 5 weeks of qualitative research methods, followed by 5 weeks of quantitative research methods. In the quantitative aspect of the module, students are taught to use STATA (a statistical programming software) to conduct various statistical tests such as t-tests for assessing differences in means, to multiple regression models estimating the relationship between an outcome variable and several explanatory variables. However, given that the quantitative aspect of the module is only run over 5 weeks, there is a tendency for students to focus most of their efforts on developing their proficiency in STATA, while placing less emphasis on being able to interpret the results from these tests accurately. For instance, students may learn to run a multiple regression analysis in STATA by inputting the appropriate commands but might not be able to fully explain the nature of the relationship between the independent and dependent variables in their regression model. By embedding tooltips within the software, students can simply hover on the output for an explanation of the results. There are also pop-up alerts that flag concerning results e.g., insignificant p-values so that students can take note of those. By pairing the software with specific exercises focused on the interpretation of results from a specific test, e.g., asking students to confirm whether the results from a t-test indicate significant differences in the average of two groups, I can check whether students have understood the results correctly.
How does it work?

The web-interface is designed to be very intuitive and user-friendly. The home page is designed as a data upload page where students can decide to use the dataset embedded within the software or upload their own dataset in CSV or Microsoft Excel format. Once the data has been uploaded, students can click on one of the tabs to begin analysing their data using a specific statistical test. The tabs are currently organised to follow the 5-week curriculum. Once a particular test has been selected, students can tick the variables of interest and the results are automatically populated on the screen, with tooltips appearing when you hover on the output which explain what each result means.
How did you introduce it to students?
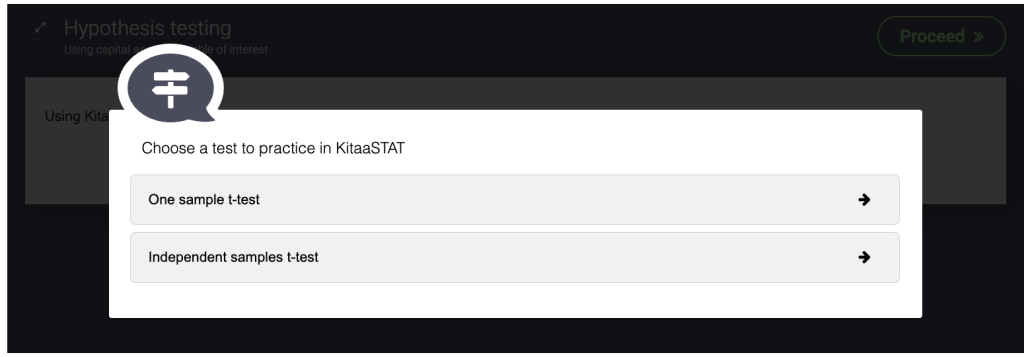
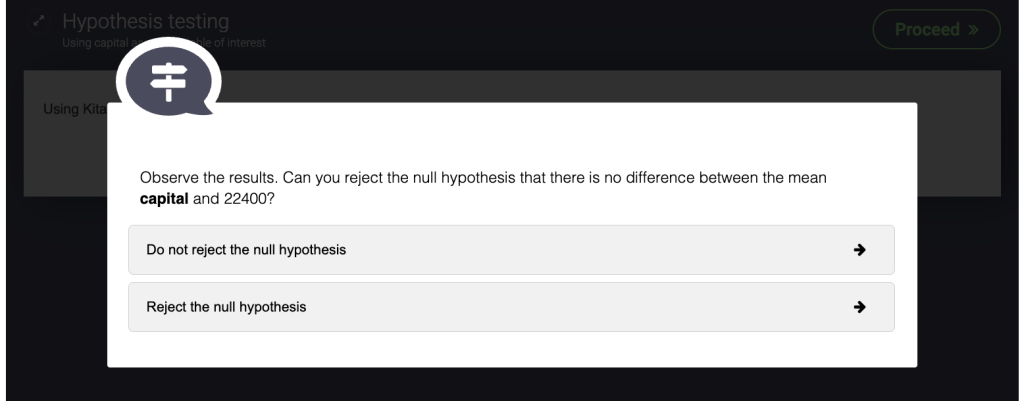
Students were introduced to the software via gameplay to encourage active learning and to make what could otherwise be a daunting exercise, quite manageable. I developed a series of exercises via H5P, which is a type of activity available within KEATS. These H5P ‘branching scenario‘ exercises allow the instructor to present interactive content and choices to students. For each branching exercise, students were provided with a dataset to upload into KitaaSTAT and were asked to conduct certain tests in KitaaSTAT and then decide on a course of action based on the results of those tests.


By pairing the software with the branching exercises, students could self-direct their own learning and could play the game as many times as needed, in groups or individually. When a student makes a wrong turn (i.e., selects an incorrect answer), they are provided with an explanation as to why their answer was incorrect and given the opportunity to try again until they get it right before moving to the next stage.
What benefits did you see?
Students were having fun with this exercise! They would usually play the game in groups, discussing the possible options together and their rationale for selecting their final answer, often cheering when they got it right.
By tackling each question in KitaaSTAT, students were able to focus on the interpretation of the results first, rather than figuring out coding syntax. The fact that students could obtain results from each statistical test quite easily and quickly also contributed to demystifying the process of data analysis and helped to improve their confidence. Students can use the tooltips provided in the software to check their understanding of the results before selecting their answers. Following the workshop, I then review the submitted attempts by all groups to observe whether students were able to interpret the results accurately by selecting the correct responses.
In an anonymous Microsoft Forms survey administered to students at the end of the module which had a 40% response rate, 100% of students who completed the survey agreed that the branching exercises were helpful for improving their understanding of and ability to interpret the results, with 94% agreeing that they found KitaaSTAT useful for interpreting output from statistical analysis.
When asked to share their thoughts on KitaaSTAT in a few words, some students stated that it was “interesting and helpful”, “Easy and efficient to use”, “It’s a convenient tool for us to learn and experiment”, and “Helpful because of the explanations”.
What advice do you have for colleagues trying this?
Make it entertaining! Learning quantitative research methods can be challenging even for students with a prior background in mathematics or statistics. By engaging students with a branching exercise which requires them to make a decision at each stage, students are able to actively participate and learn by doing, rather than focusing solely on a theoretical approach.
In addition to the pre-loaded dataset available in KitaaSTAT, it would also be useful to provide a couple of example datasets for students to practice with in KitaaSTAT so that they can see how the pop-up alerts vary with the change in results, which will help them understand the critical things to look out for when interpreting the results from their analysis.
I would also be happy to work with colleagues who would like to try KitaaSTAT or build on this further by adapting it to other modules e.g., by providing access to the data and HSP branching exercises, editing the tooltips to highlight specific information, or including more statistical tests e.g., logistic regressions.

Leave a Reply