")
By Lucy Makinson, Behavioural Insights Team |
There are several aspects of a survey panel which are necessary to ensure that the data drawn from it can be meaningfully interpreted.
1. Sample size
The panel must be sufficiently large to draw reliable conclusions about the broader population. The larger the sample size, the smaller the margin of error.[1] It’s also important to remember that if you want to look at the responses of specific subgroups– in this case, students from a widening participation background- the sample size of those specific subgroups is also important.
2. Representativeness
Representativeness is how well the people on a survey panel reflect the overall population. A panel is unrepresentative if some groups are more or less prevalent in the panel than in the overall population. This is a problem if the views of the groups which are over- or under-represented are different from the population as whole. Representativeness can be tested across observable, but not unobservable, characteristics.[2]
3. Retention
In the case of panel surveys, retention is of key importance. High attrition impacts survey sample size but, often more importantly, representativeness. This is because those leaving the panel are likely to be different from those staying on it – for example, they may be less attached to the university – and therefore the views of those who are less attached to the university will become underrepresented in later waves of the survey.
As well as developing recruitment strategies which deliver on all three criteria it is important to recognise the potential trade-offs between the different criteria in selecting strategies. For example, focusing on a particular type of incentive to increase sample size can impact representativeness, but the scale of these trade-offs is often not apparent from the outset.
Our recruitment and retention strategy
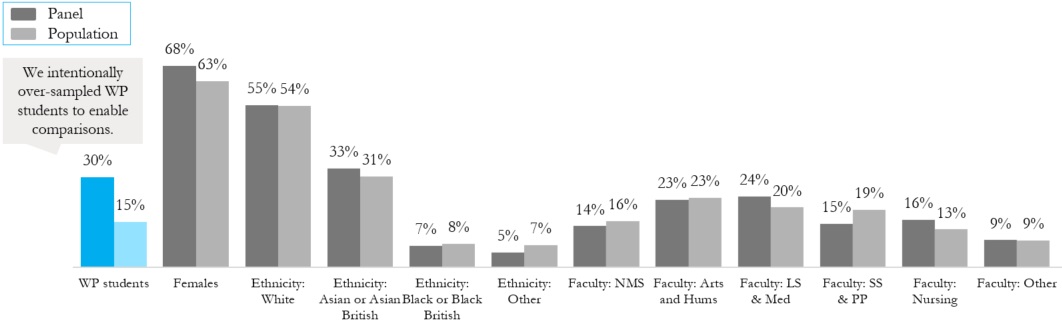
Roughly 4,500 first year students enrol at King’s each year. We set out to recruit a minimum of 700 students to our panel, which would give an initial margin of error of 3.4%,[3] and still imply just a 5% margin of error if we had an attrition rate of 50%. We sought a representative panel in all respects other than WP status.[4] We wanted WP students to make up roughly 30% of the sample so that we could make meaningful comparisons between WP and non-WP responses.
Here we detail some of the core elements of our recruitment and retention strategy. However, it is important to note that the selection of recruitment strategies and the exact form of their implementation is context-dependent.
1. We recruited in waves
Recruiting in waves allowed us to target specific groups with lower response rates to ensure a balanced sample.
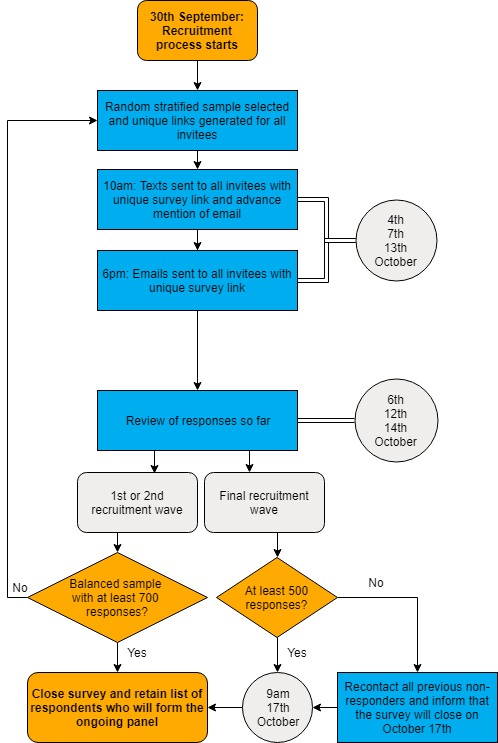
On 30th September 2016 1,000 potential participants were selected using stratified random sampling, stratified across gender, ethnicity and department, with widening participation students deliberately oversampled to make up 300 of the 1,000 recipients.
These 1,000 were sent a text offering them a chance to participate in the first survey on 4th October. The message also informed them that they would receive an email with the link should they prefer to complete the survey online, with emails being sent that evening.
A few days later the composition of the panel was reviewed and another round of invitations were sent if the panel sample had not reached 700. The invitations in this round oversampled demographics which had lower panel sign-up rates in the first round to achieve a balanced final panel. There was to be up to three recruitment rounds. The procedure is detailed in full in Figure 1.
2. We asked for upfront commitment
Individuals like to be consistent and explicit commitments can have a strong influence on future behaviour,[5] including in the context of mail-response surveys.[6] To support retention through the panel waves we told all potential panel members that there would be six surveys through the year, stated the time commitment required, and emphasised the importance of responses to every survey.
This information was presented at the start of the first survey, and respondents had to make an explicit commitment to answering all six waves in order to continue to the survey. Only on completion of this first survey would they be counted as a member of the panel.
In asking for an upfront commitment we prioritised retention through the survey above the potential negative impacts on initial sign-ups.
3. We emphasised the relevance of the study
Individuals are more likely to respond to surveys when the topic is of interest to them,[7] therefore highlighting the personal relevance and significance of a survey is a useful tool for increasing response rates. However, it could also make the panel less representative if the messages only focus on areas of interest to particular subgroups of students.
In designing messages we focused on a few ways in which the survey might be of interest to students; the focus on understanding their personal experience, the impact the survey would have on the shape of student support at King’s, and the survey’s position as a significant piece of research.
By using a range of possible points of interest, but also by keeping each one broad, we aimed to maximise the recruitment effects whilst minimising associated bias
4. We used incentives
Incentives significantly increase participation in surveys.[8] That might not be ground-breaking news, but there is a lot to the design of good incentives. For example, whilst lottery incentives are effective in many contexts, there is inconclusive evidence in the context of online panel studies[9],[10] and recent work suggests guaranteed incentives are more effective.[11]
The type of incentive is also important. Incentives can bias the panel composition if they offer something which is of greater value to certain groups. In addition, incentives must not significantly change the students’ university experience – for this reason we did not use incentives which were connected to King’s (such as food or drink tokens for student cafes).
For this survey, participants received a voucher for Marks & Spencer following the completion of each wave. This was framed as a ‘thank you’ rather than a payment, to reduce potential crowding-out of intrinsic motivations for survey completion.
5. We sent (lots of) reminders, and personalised them
Students were sent up to four reminders for each wave of the survey, using both SMS messages and email. Reminders drew on a wide range of behavioural approaches, including those used in the initial recruitment. For example, they often reminded panel members of the commitment they had made at the start of the survey, and reiterated the potential impact of the survey.
In later waves the reminders were adapted based on the response pattern of the panel member. Those who had missed a recent wave could receive a message inviting them to return, whilst persistent responders were thanked for their commitment.
Our final sample
We recruited 769 first year students to be part of the panel. The panel was representative of the student population on all observable characteristics other than gender, with females being slightly more prevalent in the panel than in the first year student population at King’s. However, the extent of this divide was minimised through our wave-based recruitment which heavily targeted male students in the later waves.
Neither the slight underrepresentation of the Social Sciences and Public Policy faculty, nor the slight overrepresentation of Life Sciences and Medicine students was statistically significant. However, the final analysis of the panel will weight the data to ensure fair representation in responses.
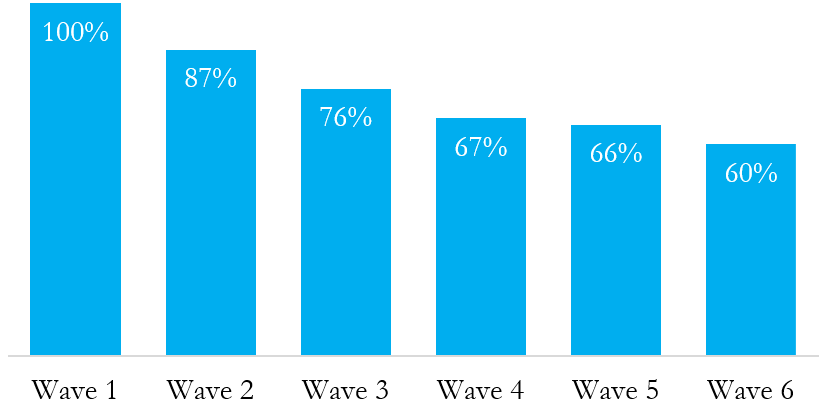
We also achieved a reasonably high retention rate throughout our panel, with over 60% of panel members responding to our final survey. This was particularly notable as the final wave took place a considerable period of time after the conclusion of the academic year, when it is often harder to engage students.
We will be making more details of the survey content available in October, but this will only be available through our mailing list.
Click here to join our mailing list.
Follow us on Twitter: @KCLWhatWorks
Footnotes
[1] The margin of error specifies how close to the views of the population you can expect the survey responses to be. A 3% margin of error says that responses to the survey will be within 3% of the responses you would get by asking everyone in the population. This will be true 95% of the time, if the confidence interval is 95%.
[2] Observable characteristics are those we have information on, such as gender or subject studied. There are lots of possible unobserved variables which may affect responses but for which we don’t have data, for example how many other students the respondent knew when they arrived at KCL.
[3] Using a 95% confidence interval.
[4] We defined WP students as those with an ACORN consumer classification of 4 or 5.
[5] Lokhorst, A. M., Werner, C., Staats, H., van Dijk, E., & Gale, J. L. (2011). Commitment and behavior change: A meta-analysis and critical review of commitment-making strategies in environmental research. Environment and Behavior, 0013916511411477.
[6] Hinrichs, J. R. (1975). Effects of sampling, follow-up letters, and commitment to participation on mail attitude survey response. Journal of Applied Psychology, 60(2), 249.
[7] Groves, R. M., Presser, S., & Dipko, S. (2004). The role of topic interest in survey participation decisions. Public Opinion Quarterly, 68(1), 2-31.
[8] Booker, C. L., Harding, S., & Benzeval, M. (2011). A systematic review of the effect of retention methods in population-based cohort studies. BMC Public Health, 11(1), 249.
[9] Porter, S. R., & Whitcomb, M. E. (2003). The impact of lottery incentives on student survey response rates. Research in Higher Education, 44(4), 389–407.
[10] Heerwegh, D. (2006). An investigation of the effects of lotteries on web survey response rates. Field Methods, 18(2), 205–220.
[11] Stevenson, J., Dykema, J., Cyffka, K., Klein, L. and Goldrick-Rab, S. (2012). What are the Odds? Lotteries versus Cash Incentives. Response Rates, Cost and Data Quality for a Web Survey of Low-Income Former and Current College Students. Presented at The American Association for Public Opinion Research (AAPOR) 67th Annual Conference, May 18th 2012
Leave a Reply