This blog is part of a series from Director of Equality, Diversity and Inclusion, Sarah Guerra, where she will be addressing the ‘whole picture’ of EDI, why it is important, and how we go about making effective, systemic change.
EDI is underpinned and driven forward by good quality, broad and deep data. Data is the starting point and can often be the biggest barrier to progress – whether you have it or not.
The critical role of data collection and analysis is to understand current challenges and opportunities in terms of EDI across the organisation. Data helps us to address questions and look at how we should be planning for the future. It empowers us to understand what we don’t know and so encourages credible research to clarify and demystify the current reality. It also serves an important role in evaluating outcomes – is what you are doing making any difference? Are you being successful?
Getting and using data involves a variety of aspects:
Systems: having the ability to collect the data safely and efficiently. If you are a staff member at King’s, have you checked out our PowerBI dashboards?
Expertise: once you have it, being able to analyse and understand what it means. At King’s we have many amazing teams to help us do this – People, Data and Analytics and EDI in HR, our Business Analytics colleagues and the What Works Unit to name a few of the key players.
Disclosure – getting people to give trust you and give you their data. Check out this short video that helps you understand how and why we collect data at King’s.
Reporting – telling people what you have found out. The EDI team makes regular reports to Council, SMT and our Equality, Diversity and Inclusion Committee and Forum (EDIC & EDIF). Additionally, we also have our Annual Reports – check out our most recent one.
When pulling these together, it is important that we are clear about why we are collecting data and what we are going to do with it. Being explicit about our purposes means people are more reassured and trusting. We must show that we have learnt something from the data and importantly that we have done something. Feedback and communication are essential here.
The various charter-marks we use can seem unbelievably laborious and indeed recently, the government has called into question their ‘unnecessary bureaucracy.’ However, they help us gather relevant data, help us understand it and identify actions, and force us to assess what the impact has been. Charter-marks warrant a blog of their own, so watch out for that one!
My practitioner experience tells me that it is all too easy to put any number of programmes and initiatives in place to show that something is ‘being done’ by an organisation. Spending the time diagnosing the problems, thinking through options and designing solutions takes longer and is harder – but the focus and clarity it provides is worth it. It also requires patience and self-belief because it can feel like you are talking about the ‘doing’ for a long time. This diagnosis and design are so much harder without good foundational data.
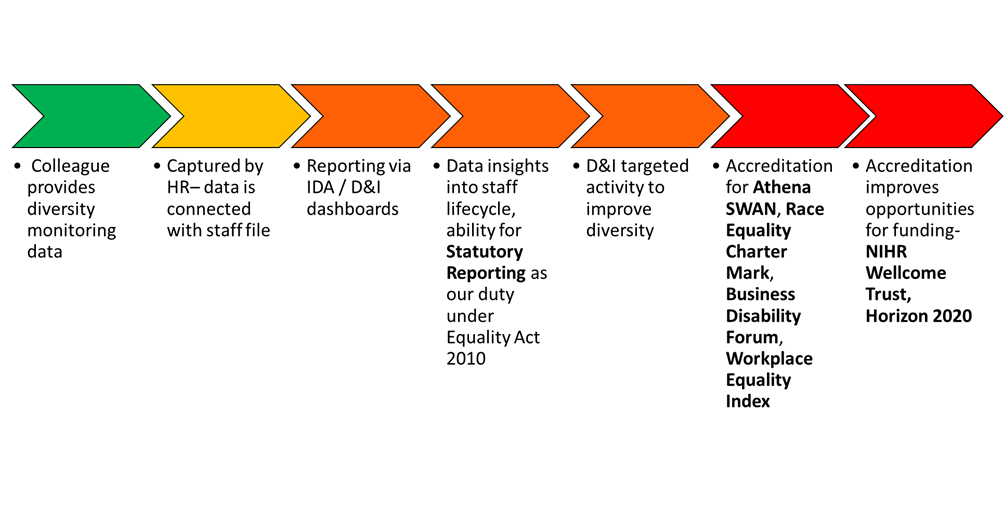
It is critical to start by understanding where you are now – the baseline – to determine targets and areas to improve. This is why one of the first things I did when I arrived at King’s was work, in partnership with our amazing Business Analytics colleagues, in particular, Richard Salter, to create the PowerBI diversity dashboards referenced above. These dashboards capture and bring together all sorts of EDI data on staff and students, for easy comprehension and interrogation. It also collates data, such as who has joined us, either as a staff member or a student, when, to do what, under what terms, how successful they are and when they leave.
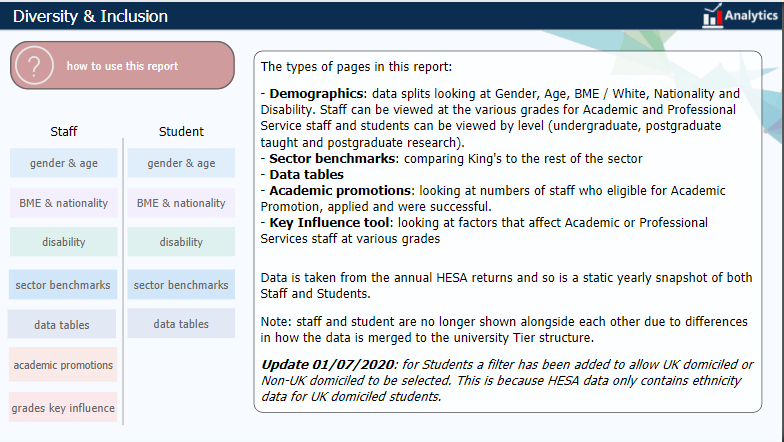
Diversity and Inclusion dashboard on PowerBI
Another element of data which provides insight is equal pay analysis and transparency on pay gap reporting. At King’s, as required by law, we report on our gender pay gap annually. Organisations are required to publish their gender pay gap analysis annually in the UK if they have more than 250 employees, concerning data collected in the same year. The requirement is to calculate and publish statistics on pay gaps between male and female employees, measured by hourly pay and bonuses, as well as the proportion of male and female employees in each pay quartile. In recent years, we have also chosen to calculate and report our ethnicity pay gap using the same method, as far as is possible.
Being transparent and sharing this analysis provides a clear measure of how fair our workplace is. Understanding whether the pay gap is rising or falling helps us determine whether our EDI programmes are helping to create a fairer, more inclusive workplace. Pay gap transparency is an opportunity to listen to ideas from across the organisation, hear about things people have learnt from elsewhere and enable our community to feel they are contributing to changes for the better.
Monitoring of starting salaries is a critical and straightforward tool in pay transparency. Most organisations, and certainly we here at King’s, have a minimum and maximum (or band of) pay rate for employees performing a particular job or function. However, as people join, local managers have some flexibility as to what rate of salary people are appointed on, often taking wider factors into consideration. There is quite a lot of research that shows women and people from certain cultures or backgrounds are less likely to feel confident to negotiate on starting a role. So, where there is discretion and flexibility, it is essential that what is happening is monitored.
The pay gap is not a perfect measure. There may be instances of the pay gap widening, or of no improvements being made across the year despite several activities being in place. This doesn’t mean they are the wrong actions, but perhaps that they need longer to take effect or they need more commitment behind them. It is critical to be open about pay gaps, where they are in the organisation and what causes them.
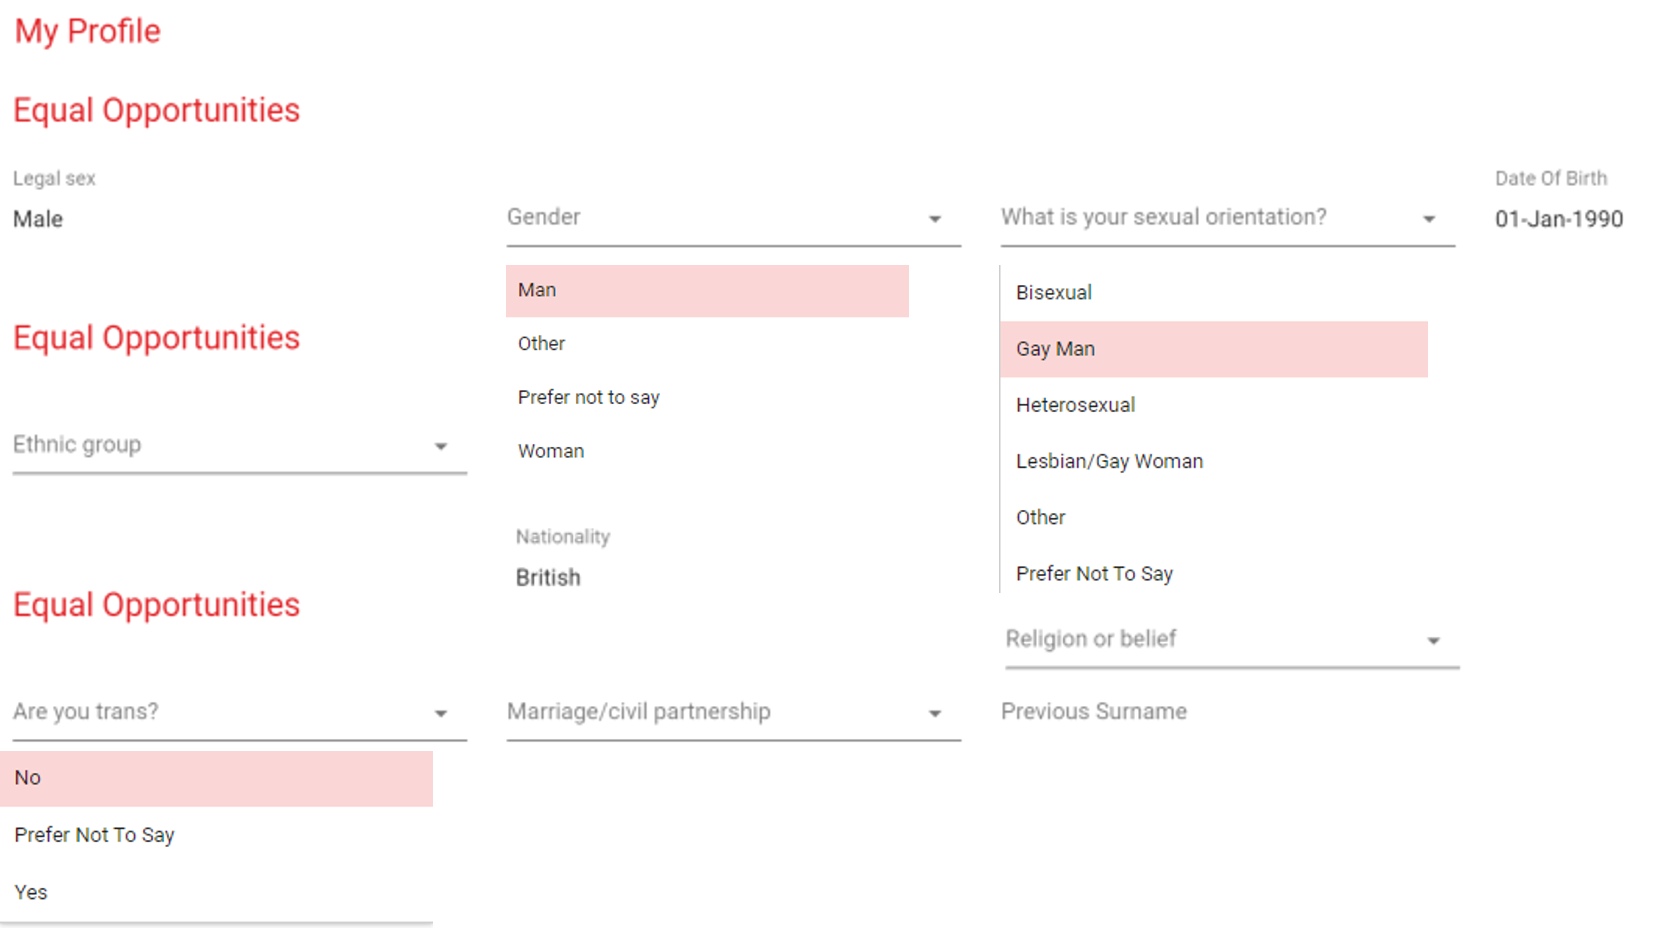
A critical area to capturing data in is recruitment. This provides a wealth of information, including: helping us determine where most candidates are entering the recruitment process; what job boards, social media sites, mobile hiring apps or referral approaches are the most effective; what resources are bringing a greater diversity of candidates. The introduction of our new HR Digital services has been a game changer for us at King’s in terms of being able to get this kind of information. Once we have had it up and running for long enough, we will have a veritable gold mine of data to access and learn from.

An example of the Equal Opportunities form through HR Digital Services
In addition, data collection during each stage of the recruitment process provides an in-depth look into the hiring process. Looking at proportions in terms of applicants from diverse backgrounds applying, compared to the number of interviews, or the number of interviews compared to the number of jobs offers across the organisation and within each function, highlights any issues that may be occurring in the process. If you read our Race Equality Chartermark application, you will see that we have a lot of improvement to make in terms of the noticeably clear and disproportionate reduction of BME candidates from application, to shortlist, through to appointment.
There are many different types of data and many ways to collect it. It is important to collect qualitative data through: employee feedback surveys; focus groups; 1 to 1 interview; competitions and awards; staff and student networks, as well as the quantitative methods described above.
The best EDI practice allows us to create a baseline and then carry out a review after programmes have been put in place to validate changes or improvements made. As I have outlined, getting good data is not easy. You need the technical tools and the expertise. You need good governance to ensure data integrity and protection. The main purpose of collecting data is to answer questions, so it is critical that the data is correct and reliable. One of the approaches we take at King’s is making use of a balanced score card, which utilises a wide variety of agreed-upon measures to evaluate organisational success, ensuring that it covers the right measures for the organisation.
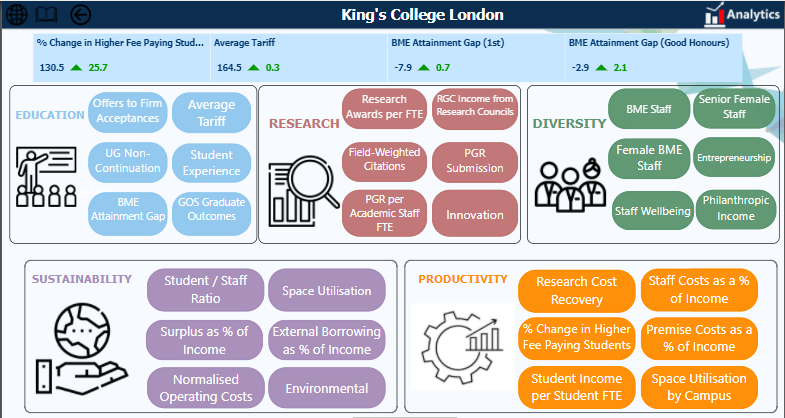
Balanced Scorecard on PowerBI, which summarises KPIs and targets at King’s
Without a doubt, data is one of the most important tools we have for EDI. It helps us build understanding of the starting point, helps us measure progress, and brings greater objectivity when making decisions on where to invest time and action. However, we should not be fooled into thinking data is neutral. It is actually something that can be very emotive, easily manipulated and provide distorted perspectives (to think further about this, I’d highly recommend Invisible Women by Caroline Criado Perez).
In being a massive data advocate and always prioritising evidence-driven EDI activity, my toolkit includes 3 things. Firstly, with any data, notice what emotions it provokes, so you can be clear as to your own objectivity and bias. Secondly, examine the context – where has this data come from, from who, and why? Finally, be curious – what does it not tell you?
Please take some time to look at our dashboards and to fill in your own information on Core HR so that we have the most up-to-date and most reliable data possible.