Although it has taken rather a long time to see the light of day, our just-published paper is one of the reasons I love my job: drawing on a mix of data science and deep geographical knowledge, we look at the role that new Machine Learning (ML) techniques – normally seen as just a ‘black box’ for making predictions – can play in helping us to develop a deeper understanding of gentrification and neighbourhood change. For those of a ‘TL;DR’ nature (or without the privilege of an institutional subscription!), we wanted to share some of our key ideas in a more accessible format.
Background
We all know that London Fields has gentrified. And Brixton. And Peckham Rye. And… seemingly everywhere in London and quite a few places besides (e.g. Brighton, parts of Manchester, etc.). Often, these areas show up on our radar after having been featured in the news thanks to the careful efforts of activists and academics working through ‘case studies’ to theorise and engage:
But that approach comes with one important downside: we are at risk of focussing too much on a few ‘signifying’ locations. Or, as Neal et al. (2016) wittily put it: ‘You can’t move in Hackney without bumping into an anthropologist’. So qualitative strategies may overlook similar changes happening elsewhere but in less photogenic/well-connected locations (Barton 2016). What we wanted to do was to see if recent advances in Machine Learning could help us to see the ‘bigger picture’ at the London scale and come to a deeper understanding of how this process worked… and where it might spread to next!
About the Method
To employ Machine Learning (ML) algorithms we need a combination of training (i.e. learning) and testing (i.e. prediction) stages. We did this in two different ways:
- To train the algorithm in the first place we give it access to 80% of the data for the period 2001 to 2011, and then we checked how well it was doing by testing it against ‘predictions’ for the remaining 20% of the data it hadn’t yet seen. Doing this several times means that you avoid ‘overfitting’ in which your algorithm pays too much attention to outliers or other rare cases in the data at the expense of good overall accuracy.
- We can then use this trained algorithm to make predictions for the period between 2011 and 2021. There are some major caveats here (and we note them in the article) but this gives us a surprisingly robust way to peer into a murky future.
We used an approach called a Random Forest to make these predictions. To stretch an analogy to the breaking point: if 20 Questions is a good example of a single Decision Tree, then using a Random Forest is like having the chance to play the same game of 20 Questions a thousand times over in the hopes of finding the ‘right’ answer. It’s (a lot) more complicated than that, but it’s a good first approximation and we try to explain it in reader-friendly detail in the article.
Replication
One thing that was really important to us is that the data and the code be freely accessible to anyone who wants to replicate our results or experiment with adding or removing data/transformations/algorithms. So, as long as you know a bit about how to set up Python, then all of our code is available on GitHub: https://github.com/jreades/urb-studies-predicting-gentrification along with instructions on how to configure the Anaconda Python (3.6) environment.
Results
Without going into all the gory details (TL;DR) we find that the Random Forest algorithm outperforms multiple regression by about 10% with a R^2 of 0.699 vs 0.639 on predicting change between 2001 and 2011. So there’s still plenty of room for improvement (we note a few areas) but it’s already a meaningful difference. MSE and MAE are also quite a bit better, especially on the tuned Random Forest. As with regression, we also get some useful information about which variables are useful for making these predictions:

We could use these results to do things like reduce the number of variables used in a new (faster) model, but that’s not particularly relevant to our needs here. But being a geographer, of course, I ultimately want to see what this all looks like on a map! So below we see the difference in our ‘gentrification score’ over the two time periods: how did areas change between 2001 and 2011, and how will they change between 2011 and 2021? [Important caveats aside.]
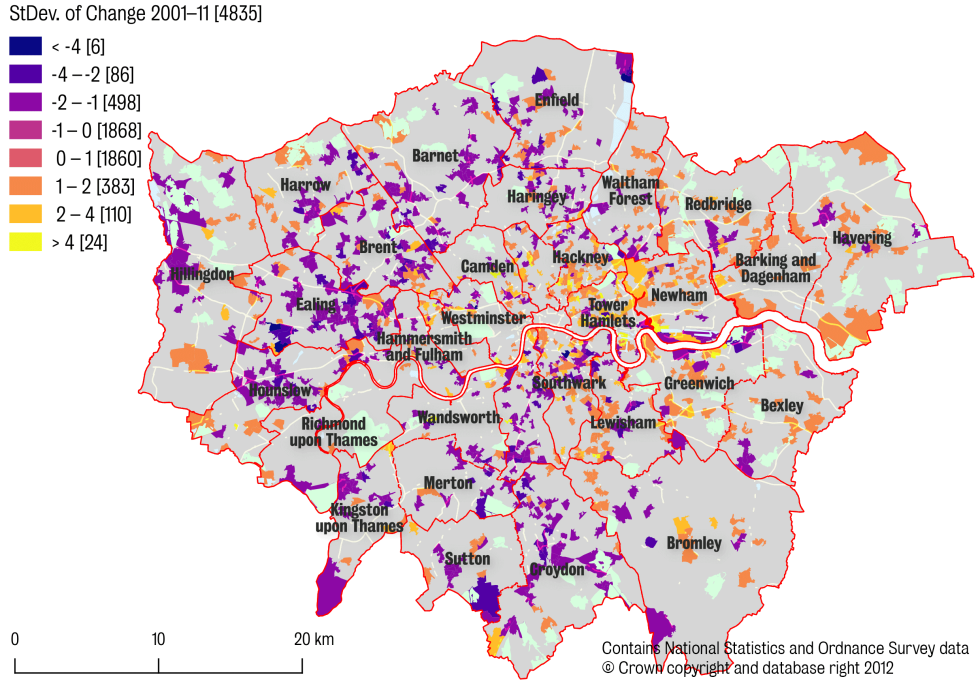

Note that we’ve removed the +/-1 Standard Deviations since these are more readily attributable to random fluctuations (i.e. noise) than to meaningful change (i.e. signal).
Wrap-up
If you live in London (or have the benefit of hindsight) then some of these predictions might seem fairly obvious because they have already happened as of 2018, but it is worth recognising that the preconditions of these changes must have been in place by 2011 for these predictions to be made! In other words, had we had access to this data in 2011, then we might have been able to do something about it! If we could incorporate more ‘timely’ data – such as from Zoopla (a property price website) or Twitter (useful as a marker of cultural change) – then we could begin to develop the next stage of the real-time ‘early warning system’ anticipated by Chapple and Zuk (2016). And that is one reason that we feel really strongly that a stronger engagement between quantitative and qualitative methods in this area would be really helpful to both branches of research.
We are not claiming to have ‘solved’ neighbourhood change, nor are we suggesting that our approach supersedes the on-the-ground work undertaken by so many before, but we do hope that, in making these predictions about change in London, we are ultimately able to identify the ways that improvement or regeneration can occur without incurring displacement or disconcerting social change. We actually hope that our predictions will be wrong, but for all the right reasons…
P.S. Image credit for featured image: https://atlantablackstar.com/2015/02/20/10-us-cities-where-gentrification-is-happening-the-fastest/