Diego Ramos, a recent MSc Environment and Development alumnus, discusses the challenges a global pandemic brought to the process of data collection for his dissertation.

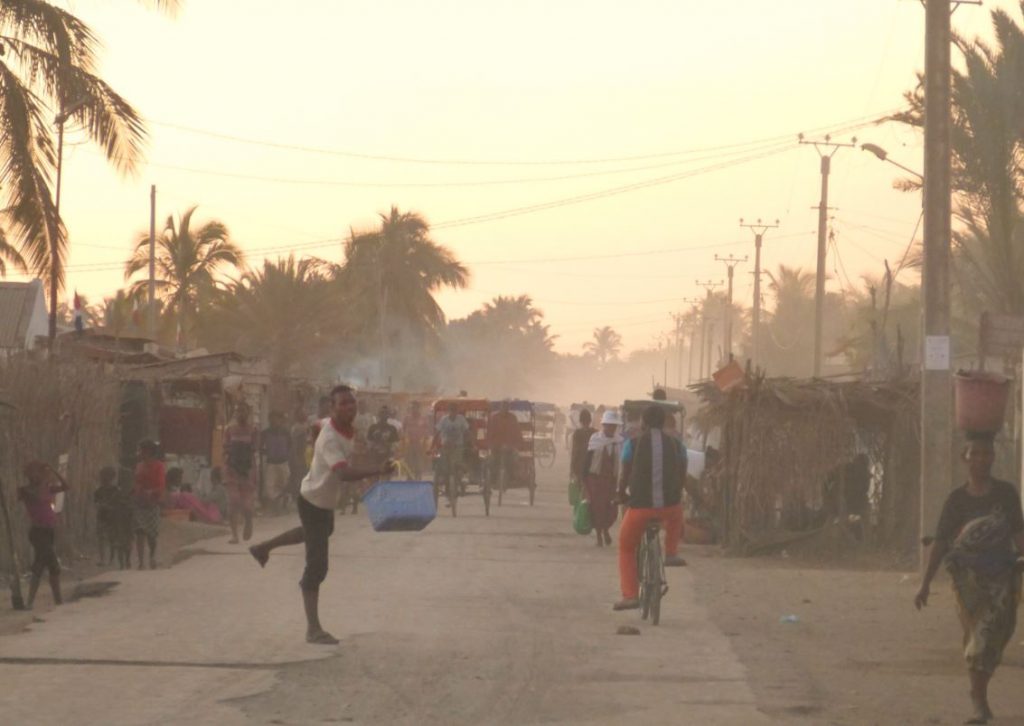
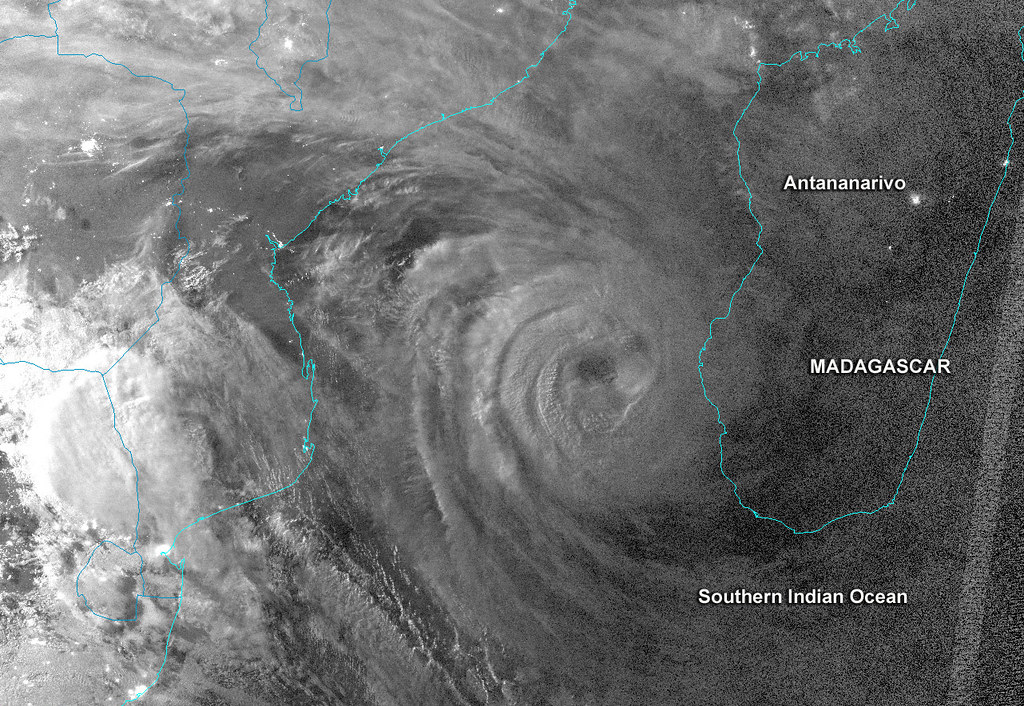
For my Master’s research at King’s, I wanted to study the vulnerability to environmental extremes of the population living in southern Madagascar. I had been to the region several times as a volunteer, so I was very aware of the challenges regularly posed by cyclones and droughts, amongst other climatic hazards. In 2013, for instance, tropical cyclone Haruna devastated the coastal city of Toliara, destroying city infrastructure, as well as ruining crops, decimating livestock and washing away to sea some of the most vulnerable houses. 40,000 locals were affected, and the rebuilding process was slow — it even took several months just for the city’s electricity access to be fully re-established. Droughts (known as kéré by the locals) are also common in a region where a lot of the population depends on subsistence agriculture to survive. What’s worse: because of global warming, it is expected that these climatic impacts will intensify in the coming decades.
When I found a tool developed by the department’s very own Dr. Daanish Mustafa to quantify vulnerability (see Mustafa et al., 2011), I realized this was a great opportunity to apply it to the context I knew. An index that enabled policymakers to identify the areas and regions most vulnerable to climatic hazards could be very useful in targeting the limited resources available more effectively, in order to better prepare and adapt to such hazards. In order to tailor the index to the local context, my intention was to conduct in-person interviews with village chiefs and other local representatives in the region. I then wanted to conduct a series of surveys to collect data to feed into the index, with the purpose of obtaining a representative picture of the variation of vulnerability across southern Madagascar.
A change of plans due to COVID-19
By March of 2020, it had become clear that the onset of the COVID-19 pandemic was going to force me to adopt a different strategy. Since I could no longer travel to collect data in person, the obvious solution was to move my research online. I had already counted on using secondary research to inform the adaptation of the vulnerability index to Madagascar, but now this was going to have a much larger weight. As Madagascar is a francophone country, researching for scholarly articles in the French literature proved very useful to collect valuable context-specific information.
I also started looking for tools to build online questionnaires. Because I wanted to present the results in map form, it was crucial that the survey I shared was equipped with some sort of geotagging feature. Thanks to support of my supervisor, Dr. Faith Taylor, I managed to obtain an ArcGIS Survey123 licence through the department. After getting acquainted with XLSforms, I was able to create an online survey, easy to navigate for respondents from any device. I shared the questionnaires through local Facebook groups, since a large majority of the country’s “connected” population is present on that social media platform. A word of warning to prospective online researchers: an important (and time-consuming) step that should not be overlooked is translating the survey materials to the local language. I was fortunate to count on several contacts on the ground that helped me translate my questionnaire to Malagasy.
The challenges of online questionnaires
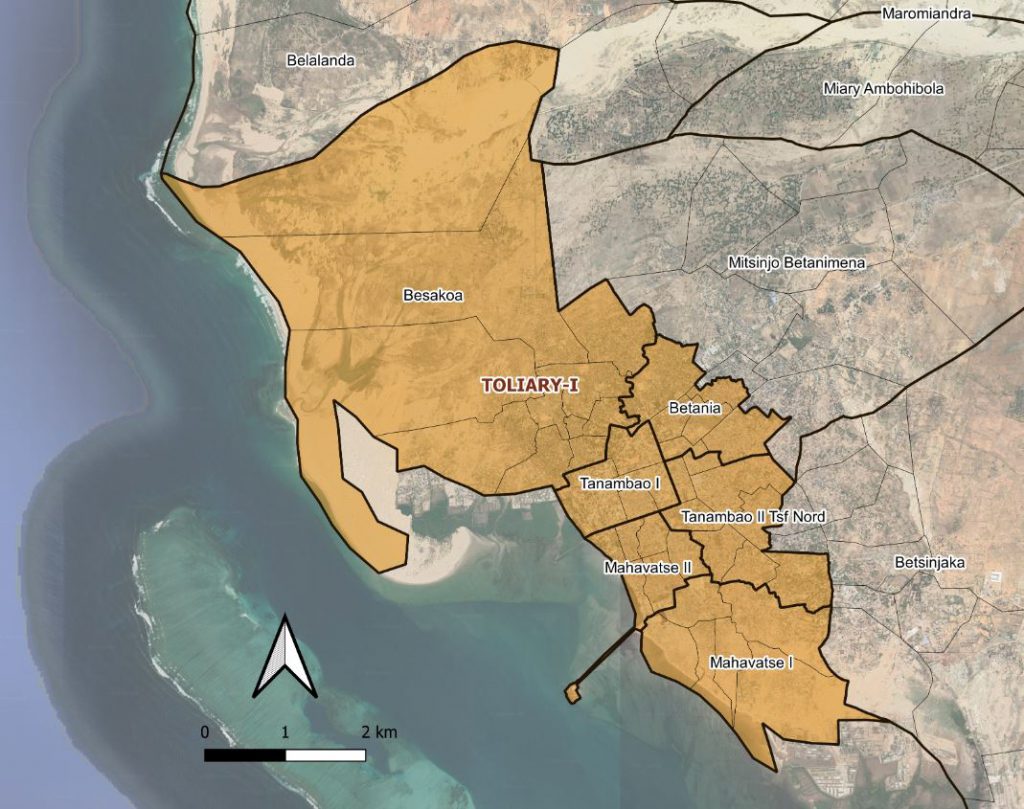
Surveys conducted via the Internet can be very powerful, because they can reach many potential respondents simultaneously, reducing the time requirements significantly. In recent years, the widespread penetration of mobile devices, fast network speeds and social media in some remote regions (such as rural Africa) has enhanced the feasibility of online approaches. However, online research is not devoid of limitations. Because my questionnaire now required access to a mobile phone or computer (and to the Internet!), I was forced to restrict the scope of my study. It was no longer possible to collect data from rural areas —since many of them lack electricity access— so I decided to focus on the city of Toliara exclusively. The high illiteracy rates in the region represented an additional barrier: the questionnaires were less accessible for many respondents than the in-person, oral surveys that I had originally sought to carry out. Some potential participants even mentioned their fear of the online survey being a sort of scam.
I also realized there were some deeper, more subtle effects taking place within my sample. Inequalities in phone ownership or access to the Internet had likely skewed my target sample away from the most marginalized and vulnerable groups. For instance, most of the questionnaire respondents reported having access to running water and adequate sanitation, despite local research pointing out that these conditions are not widespread in the region. Clearly, the online approach had missed the ‘poorest of the poorest’, so it was important to acknowledge this flaw. I decided not to treat my results as ‘final’, but rather use them as part of a ‘proof of concept’ approach to test the vulnerability index.
Credit: NASA Goddard Photo and Video, licensed under CC BY 2.0
Outcomes of my research
My ultimate objective was to produce a tool to be easily adopted by policymakers and other relevant organizations operating in the region. For this, I created a policy briefing outlining the index’s main elements and detailing its functionality. Through this document, I also shared other findings of my research — such as the fact that some governmental recommendations to reduce the risk of climatic hazards had not been successfully taken up in Toliara. Currently, I am working on developing a program to calculate vulnerability scores automatically from the responses to the questionnaire, which will make the index more practical with large datasets.
I hope that I have managed to reassure current students that even if remote research can feel somewhat disconnected from the targeted study region, online methodologies may well lead —just like traditional research methods— to having real, tangible impacts.
If you wish to contact me feel free to do so via my email: diego.ramos_aguilera@kcl.ac.uk
Read more about the 2013 Cyclone Haruna in this short article from ReliefWeb: https://reliefweb.int/report/madagascar/tropical-cyclone-haruna-hits-southwestern-madagascar