In this guest post from King’s Geography PhD Student, Jake Simpson describes some of his geocomputational work analysing data from tropical peat swamp forests to estimate carbon emissions.
In December 2015, I travelled to an area just outside Berbak National Park, Sumatra. This area comprises both pristine and impacted tropical peat swamp forest, which is one the world’s most important terrestrial carbon stores, and home to a small, endangered population of Sumatran tigers. The area was heavily impacted by wildfires between July and October, which made headlines across the world when the pollution from the fires reached as far as Vietnam! In total, about a fifth of the area burned, and in the process, emitted a globally significant amount of carbon into the atmosphere.

Quantifying the carbon emitted is a tricky business because it cannot be measured directly. One way to estimate the emissions is to measure the amount of peat that burns away. Using digital elevation models (DEMs), the volume of peat burned is estimated by subtracting the post-burn DEM from the pre-burn DEM. We have access to a pre-burn DEM from an airborne LiDAR survey for an area of peat swamp forest. With some clever filtering, the ground level can be extracted from the LiDAR data, even when dense forest is present.
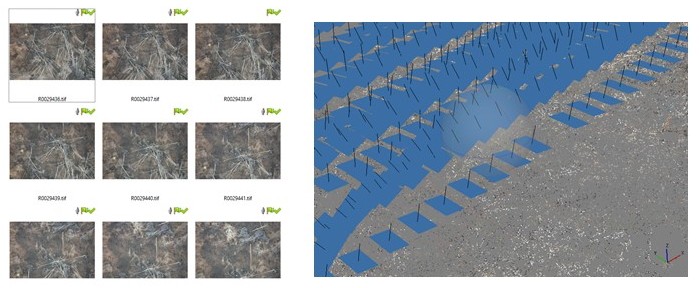
We then used a very cheap unmanned air vehicle (UAV) with a camera strapped to the bottom to survey the post-burn area to extract a DEM. This technique is called structure from motion (SfM). For a given area, multiple photos are taken from different angles and then loaded into software called “Agisoft Photoscan”. The software uses photogrammetry algorithms to identify common points between photographs, and aligns them. Other algorithms compare the location of these common points in relation to each other, and in doing so reconstructs a 3D point cloud of the surface. This process is incredibly computer-intensive and can take several days to complete, especially when up to 1,500 photos are used per survey. The steps I took in the analysis are summarised below.
Overall, I processed 8 UAV surveys, which equates to over 8,500 photos and over 2.5 billion point cloud data points. Thanks to the Geocomputational hub, I was able to process these photos and am in the process of writing up the analyses for a paper. Stay tuned…
Step 1: Photos are aligned, camera positions are predicted (blue), tie points detected.
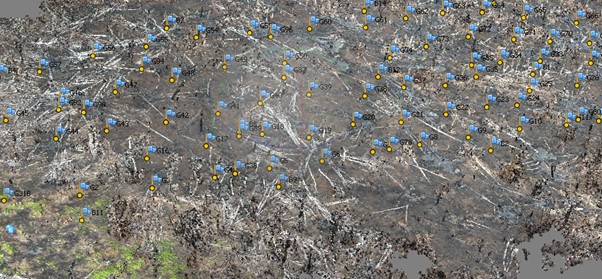
Step 2: Identify ground control points (with coordinates measured in the field) in the photos for georeferencing purposes
Step 3: Build dense point clouds, DEMs, orthomosaic photos. Here is a before and after shot of the forest we surveyed.