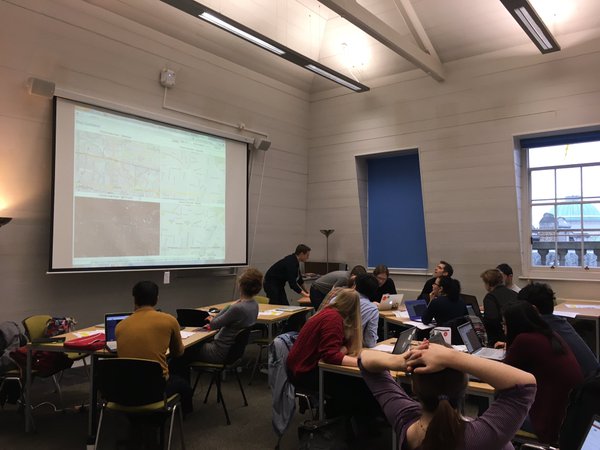
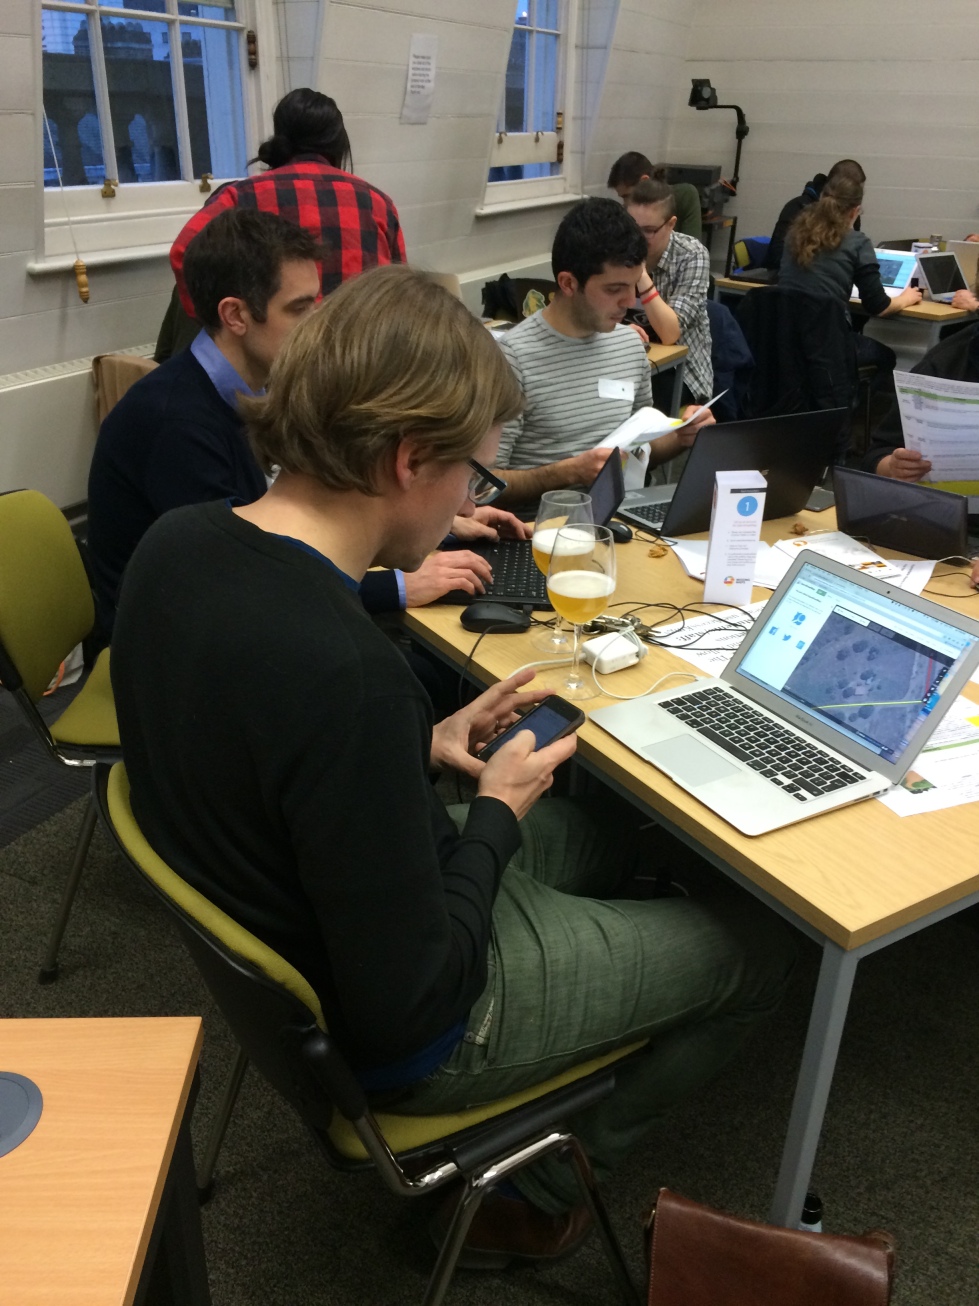
On Monday 21st March 2016, Faith Taylor and I managed to organize a MissingMaps mapathon here at KCL.
What follows is not a mere report of the event (it’s been great fun, just look at the pictures!), but rather an attempt to cover certain aspects of a mapathon which usually might be overlooked, and that I instead consider to be of interest for an academic audience.
Background
Let’s start first with an obligatory (short) background on the Missing Maps initiative.
Quoting from the MissingMaps website:
Each year, disasters around the world kill nearly 100,000 and affect or displace 200 million people. Many of the places where these disasters occur are literally ‘missing’ from any map and first responders lack the information to make valuable decisions regarding relief efforts.
Missing Maps is an open, collaborative project in which you can help to map areas where humanitarian organizations are trying to meet the needs of vulnerable people.
Masterfully summed up with a one-liner, their aim is thus to:
Put the World’s Vulnerable People on the Map
Hence MissingMaps (from now simply referred to as MM) acts as a catalyst to solicit new contributions on OpenStreetMap (OSM) in areas that otherwise would tend to be:
- Under-represented
- At potential risk of Natural Hazards
This helps organizations and NGOs such as Médecins Sans Frontières/Doctors Without Borders (MSF), the Red Cross and the Humanitarian OpenStreetMap Team (HOT) to carry on their field work with up-to-date cartographic products, while at the same time enriching the OSM database.
Invaluable tool for research
As part of the DfID-ESRC funded Urban Africa Risk Knowledge Project (Urban ARK), focused on breaking the cycles of risk accumulation in sub-Saharan Africa, Faith’s research requires better understanding of what structures might be impacted by hazards such as earthquakes and floods, and how people and goods move about during a disaster. This clearly relates to improving also our understanding of the built infrastructure in a hazard-prone city.
Karonga, a small town in Northern Malawi part of the Urban ARK initiative, only a couple of weeks ago wouldn’t have met such requirements due to a complete unavailability of data.
But given the open nature of OpenStreetMap, which is freely editable by anybody, the mapathon has proven to be a powerful way to improve the basemap of Karonga. Helping plenty of other NGOs and working in the area on topics such as development, sanitation and health, in addition to contributing to Faith’s work.

Networking
This leads us to the second point of this post: the additional benefit of hosting a mapathon isn’t just limited to an evening of fun (for those of you who possess a penchant for maps). But it’s a rather excellent moment for stepping outside the traditional boundaries of academia and connect with a wide breadth of professionals.
Checking the guest list we realized in fact that only a portion of all the guests actually were part of KCL, with a good amount of external attendees coming from all walks of life: NGO and humanitarian crisis mappers, GIS technicians specialized in Natural Hazards, Red Cross UK members etc..
During the evening we had a few hours at our disposal to get to know new people. And not only while mapping or during the break over a slice of pizza! Network building and socializing was actively encouraged, as throughout the whole event a whole range of spontaneous talks ignited discussions and interesting topics were shared among the mappers.
Andrew Braye, GIS team lead with the British Red Cross, provided a list of “GIS-sy tips”, events and people from the geospatial community worth to look at:
- Royal Geographical Society (with IBG)
- Humanitarian OpenStreetMap Team
- The Missing Maps
- MapAction
- AssocCartONG
- MapGive
- King’s Geocomputation
- CASA UCL
- OSMLondon
- FOSS4G
- Maptime!

A Quick Note on Dissemination
Lastly, as with projects of different nature, communicating the results is of paramount importance.
The OSM community offers an easy tool, developed by Pascal Neis, which can be used to monitor and retrieve stats from a mapathon. The tool filters changesets by a specific comment, which, in our case, was the #UrbanArk hashtag.
See it in action here.
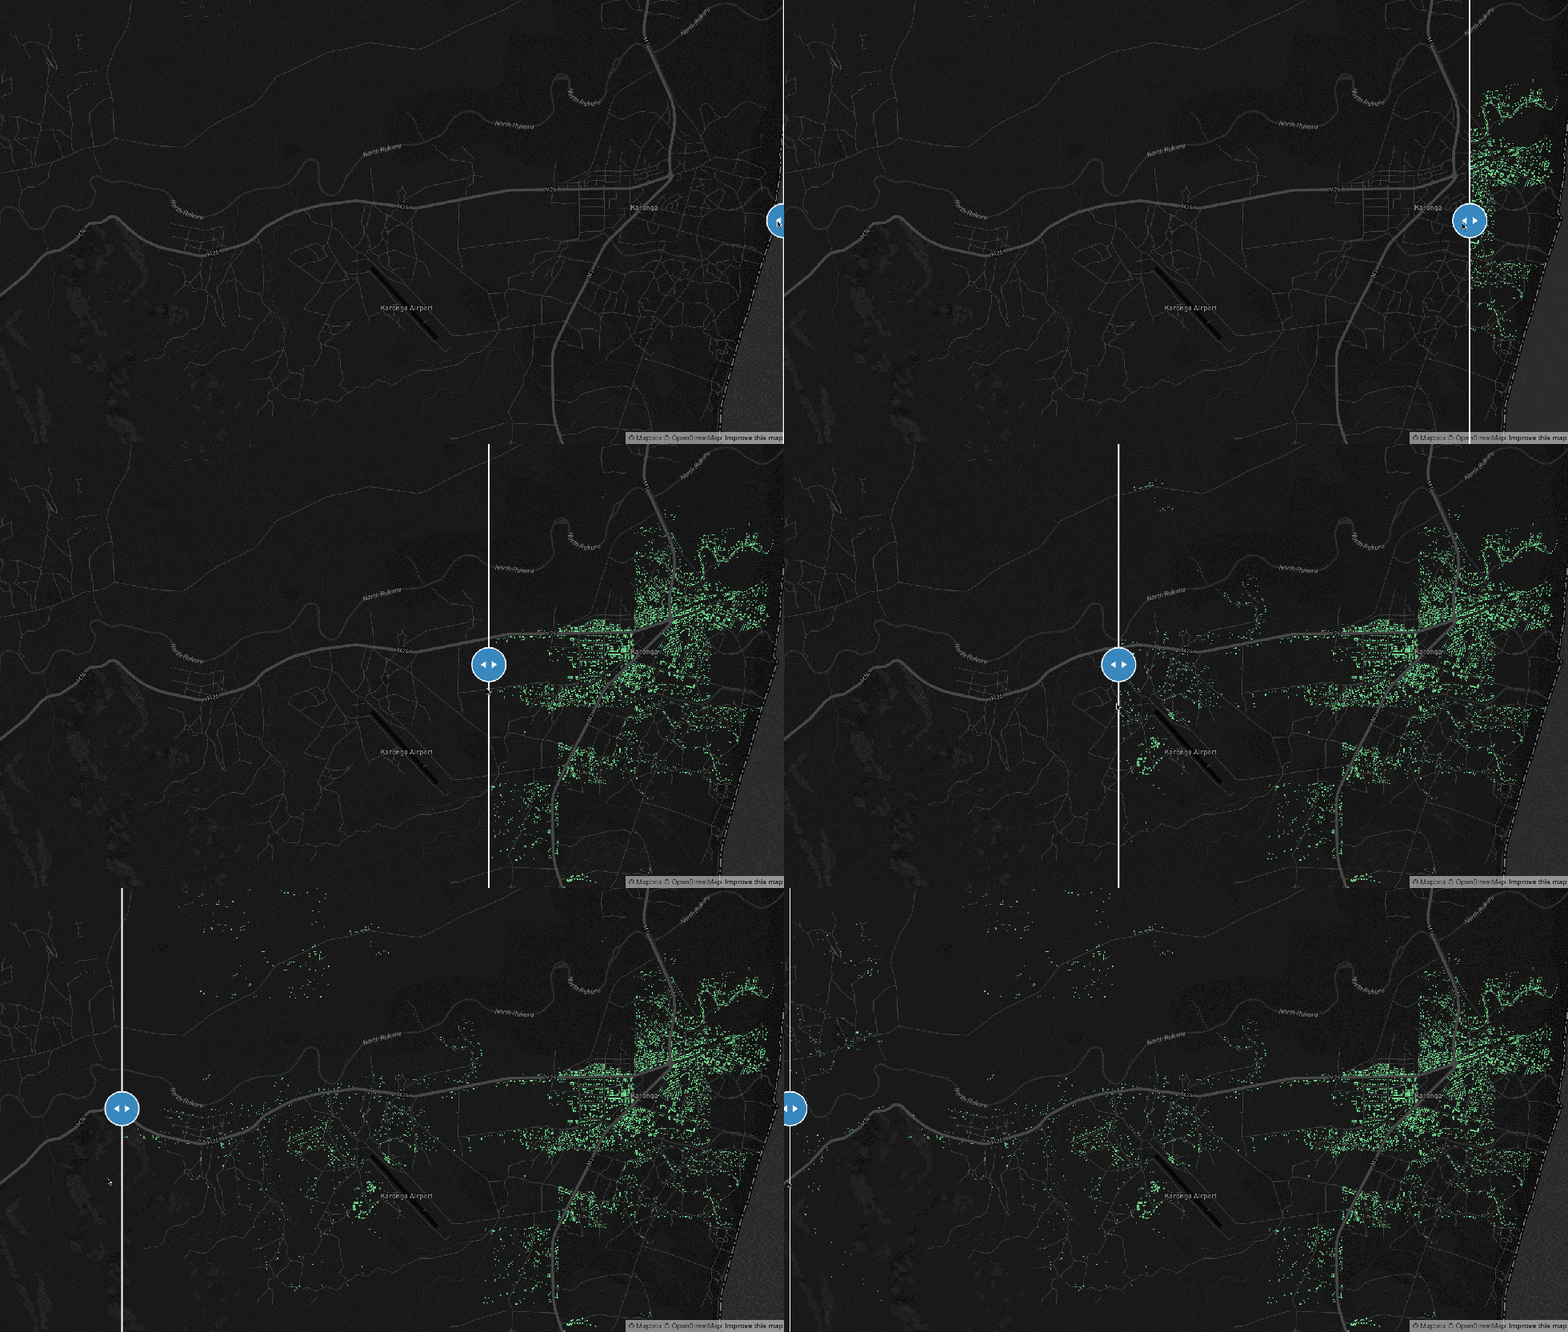
Another approach is to get the data and then render it yourself. This is precisely what I’ve done to produce the slippy map hereafter:

Firstly I’ve downloaded all the buildings mapped since our task (numbered #1641) opened on the HOT Tasking Manager. To do so I’ve used an OverpassTurbo query (try it here):
[diff:"2016-03-14T15:00:00Z","2016-03-24T15:00:00Z"];
(
 way["building"](-10.021215, 33.770943,-9.8744528,33.962517);
);
out body;
>;
out skel qt;
The query calls the Overpass API asking for all the polylines tagged with a key property equal to “way” regardless of the value of such property (Remember that all OSM features are “classified” on the basis of a key-value tagging system!). This means that I’m retrieving all buildings regardless of their use/typology (i.e. schools, churches, residences..). I’ve also specified a Bounding Box and a starting+ending date to temporally delimit the search.
I’ve then used Mapbox GL JS to create two layers, in order to render the before/after state.
If you want to know more, I’ve created a repo on my Github account where you can download the code and play with the map.
Take-Away Points:
The aim of this post was to account for the KCL Geography for Missing Maps event not just by giving a narrative of a Mapathon night (you should come and experience it yourself! Monthly events are scheduled in London and over the world) but rather to shortly explain its value and potential for an academic crowd.
So remember, a Mapathon is:
- quick and easy to organize
- a powerful catalyzer of interest toward a topic and an area, that might help gather data for your research
- an effective way to connect with other communities and professionals outside of the Academia
