
Trying to say what would have happened is difficult. Alternate history is a type of fiction that explores what might have happened if a particular historical event had occurred differently. We recently published a paper exploring what might have happened had cervical screening not been introduced in England in 1988 (or since). This paper is our attempt at an alternate history. It analysed data on cervical cancer over the last 40 years and compared rates today with what we think would have happened in the absence of screening.
Thousands prevented from developing cancer
The headline figure is that we estimate that screening in England prevented some 65,000 cancers between 1988 and 2013; and that in 2013 there were nearly 5,000 fewer cervical cancers than there would have been had there been no screening. That’s quite a staggering number and emphasises the huge success of an often under-appreciated cancer screening programme.
But how did we reach that figure and is our alternative history any more realistic than the Handmaid’s Tale or the Man in The High Castle?
The basic model
In this alternative history, we studied trends in cervical cancer rates in the pre-organised-screening era between 1972 and 1988 and extrapolated to what we think they would have been today had organised screening never been introduced. We then compare that with what actually happened. Predicting what would have happened 25 years later is not easy. Some would say it is just guess-work, but in the case of cervical cancer there are several factors that help us. Perhaps uniquely, our model explicitly allows for both a higher proportion of women born more recently to have been exposed to the viruses that causes cervical cancer (vertical shift model) and to have been exposed from a younger age (horizontal shift model).
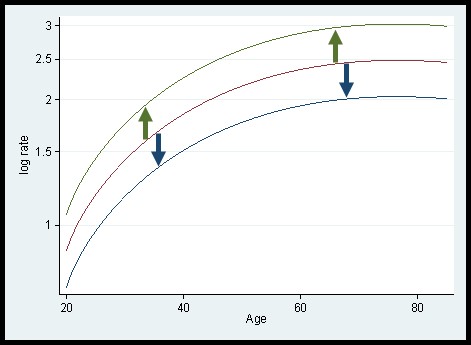
One thing that helps is the fact that not all women were offered screening in 1988, so we can continue to observe the rates of cervical cancer in unscreened women (those born before 1923) after 1988. The second is that if we look at the data before 1988 (and the data on cervical cancer mortality between 1950 and 1988), a simple model fits the data very well. It was observed that the incidence of cervical cancer is determined primarily by the age of the women, but that women born in some years were at higher or lower risk throughout their lives than women born in other years. In other words, the incidence in a woman depends on her age and year of birth. In fact, a simple model works well: log(rate) = f(age)+g(year-of-birth), where f and g are functions (or smooth curves). Biologically, the model says that exposure to risk factors (in this case human papillomavirus or HPV) before the age of 25 predicts the risk of a group of women for the rest of their lives. So, if one group have 50% higher risk when aged 25-34 they will also have 50% higher risk aged 55-64. Plotting the log-rate against age, one has a curve for each birth cohort. The curves all have the same shape but are shifted up or down. We will refer to this as a vertical shift model. It is a special case of an age-period-cohort model in which there is no period effect.
Given the simple model fits the data well prior to the introduction of organised screening we can assume that deviations of the observed rates from the predictions of this model represent the impact of screening.
Life is never so simple [Warning: this section is a bit technical – feel free to skip]
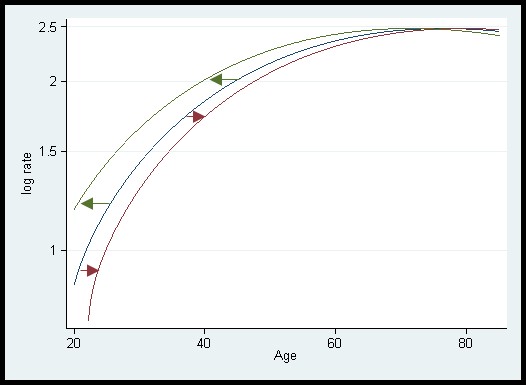
If, compared with earlier birth cohorts, a greater proportion of a cohort is exposed to HPV by age 30, then (in the absence of screening) that cohort will have a greater risk of cervical cancer at all ages. Since we know that women born in different years were more or less likely to get HPV infections, the vertical shift model makes biological sense. But there is another possibility. Different cohorts are characterised by being exposed to HPV from a different age. To account for this, we should shift the whole curve to the left or right. If one group were exposed from age 18 and another from age 15 then it would be as if the latter are biologically three years older than their chronological age. We call this a horizontal shift model.
A difficulty is that to map from one straight line with a particular slope to another with the same slope we can either shift the line vertically or we can shift it horizontally. When the line is not straight the implications can be very different. If the basic shape of the curve is increasing from age 20 to 50 and then plateauing, then with a vertical shift corresponding to a doubling of risk the impact at age 60 is huge, but with a horizontal shift equivalent to having a biological age 5 years older than the chronological age, there is virtually no change in risk at age 60.
In our paper we used both a vertical and a horizontal shift to model the effect of both a higher proportion of women being exposed to HPV and an earlier average age at first exposure.
Triangulation [if it not only looks like a cat, but also feels like a cat and sounds like a cat, maybe it is a cat]

You may think that modelling cancer trends is at most a crude approach to estimating the impact of cervical screening at a population level, but the two predictions we make corroborate well with the results of studies with very different designs. Firstly, our estimate of screening having prevented about 5000 cervical cancers in 2013 is similar to what would be estimated if we used the relative risk of cervical cancer in regularly screened, and irregularly screened women compared with never screened women and combined with the proportion of the population who are regularly and irregularly screened. Secondly our estimate that the age of first sexual intercourse has become one year earlier every 10 years since the early 1970s is roughly in line with the observed results from surveys.
We can never be certain what would have happened had there never been a cervical screening programme in England, but careful statistical modelling can provide sensible estimates of the effect of screening and make useful predictions of what is likely to happen in the future.
The views expressed are those of the author. Posting of the blog does not signify that the Cancer Prevention Group endorse those views or opinions.
Indeed, Cervical Cancer needs to be managed like a pandemic.
More awareness programmes are needed.