Example Users
WaterWorld and Co$ting Nature are sophisticated spatial policy support systems for mapping water risk, ecosystem service provision and the impacts of scenarios for climate and land use change and/or land and water management interventions. They have been developed by King’s College London and a range of partners Their use has grown significantly in the years since they were delivered to a much wider group of users through a simple web-based interface aimed at supporting decision-making and policy formulation. The tools are unique in combining “big data” and sophisticated spatial models in a simple and globally applicable web-based policy support system making scientific data and understanding universally accessible and useful to a range of users.
This post characterises the geography of current users, their areas of interest and the types of use to which these tools are put using statistics for the year to November 213.
The systems have more than 1000 registered users. In the last year the tools have been used by 823 organisations from 114 countries with the most frequent users being Conservation International, UNEP-WCMC, World Bank Group, University of Southampton, Resources for the Future, ZSL, Amazon Conservation, Birdlife International, Cornell, Stanford and Earthwatch, alongside many smaller overseas NGOs and universities.
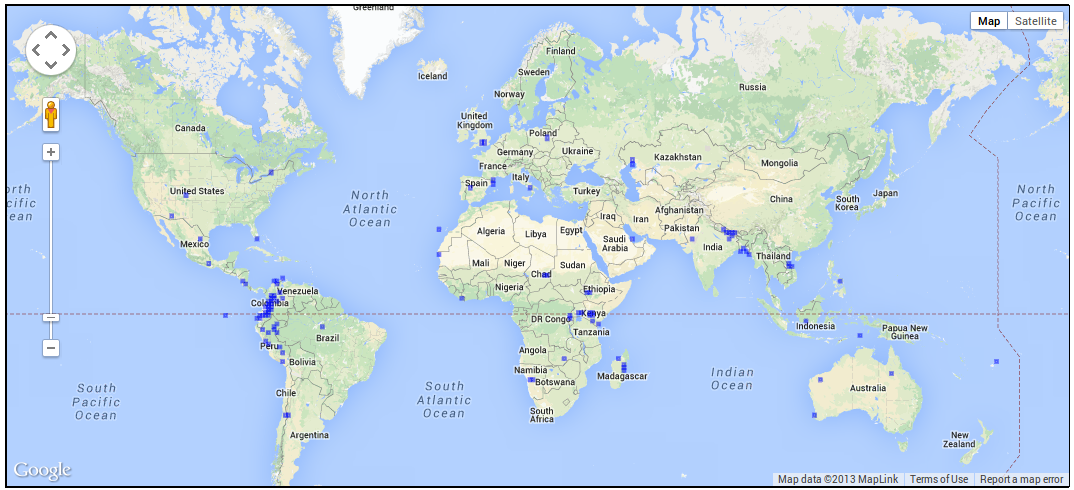
Users are distributed geographically as shown in the Figures 2 and 3 below with a particularly strong presence in USA, Europe and the Andean countries but a significant number of users in 114 countries. The number of organisations using the systems is greatest in Europe, North America and South America with less use per-organisation and fewer organisations based in in Africa and Asia currently using the systems.
A snapshot of the areas in which the tools had been applied by users is given in Figure 1 for Costing Nature (top row) and WaterWorld (bottom row). Costing Nature has been applied a number of times to 107 local scale (1-hectare) tiles (top left) largely in Latin America, West Africa and South Asia and to 119 regional scale (1-square-km) tiles (top right) covering most of the world. WaterWorld has been applied a number of times in 319 local scale (1-hectare) tiles distributed throughout the world and 374 regional scale tiles (covering the whole terrestrial land area) for version 1 and 77 regional scale tiles (covering most of the tropics) for version 2 (bottom left).


Example Uses

Figure 2 PSS users for last 12 months by country (excluding UK)

Figure 3 PSS users for last 12 months by city (excluding London)